Analyzing Dot Plots
Watch this topic in 60 seconds
Free preview · Lesson 1
Understanding Analyzing Dot Plots
Understanding Dot Plots: A Simple Guide for 7th Graders
Hey there, future data detectives! Have you ever tried to quickly understand a bunch of numbers? Maybe you're looking at the scores of your favorite sports team, or the number of books your classmates read last month. Raw numbers can be tricky to make sense of. That's where a super helpful tool called a Dot Plot comes in!
What is a Dot Plot? Think of it like a Snapshot!
Imagine you're trying to figure out how many pets each person in your class has. You go around and ask everyone. You might get answers like: 1, 0, 2, 1, 3, 0, 1, 1, 2, 5, 0, 1, 1, 2, 0, 1. That's just a messy list!
A dot plot is like taking a quick picture of all those numbers and organizing them on a simple number line. Each number gets a dot stacked on top of it. It instantly shows you where most of the numbers are, where they spread out, and if there are any unusual ones.
Analogy Time: The Movie Theater Seat Map!
Think of a movie theater. The screen is in front, and you have rows of seats. A dot plot is a bit like looking down at a small section of seats. Each number on the bottom (the number line) is like a specific seat number in a row. And each dot is like a person sitting in that seat. If 5 people choose seat #3, you'd see 5 dots stacked above the number 3 on your dot plot.
The Building Blocks of a Dot Plot
Every good dot plot has a few key parts:
- 1. The Number Line (Our "Seat Row"): This is the horizontal line at the bottom. It shows all the possible values or categories for the data you're looking at. For our pet example, it would range from 0 (no pets) up to the highest number of pets someone has (maybe 5).
- 2. The Dots (Our "Moviegoers"): Each dot represents one piece of data. If three students have 2 pets, you'd see three dots stacked one above the other directly above the number '2' on the number line.
- 3. Title and Labels (Our "Movie Name" and "Seat Type"): Just like a good map, a dot plot needs a clear title so you know what you're looking at (e.g., "Number of Pets per Student"). The number line should also be labeled (e.g., "Number of Pets").
How to Read a Dot Plot: Unlocking the Story
Once you see a dot plot, it's like magic! You can immediately start answering questions:
- How many data points are there in total? Just count ALL the dots! Each dot is one person, one measurement, one piece of information.
- What's the most common value? Look for the tallest stack of dots! That's called the mode. In our movie theater analogy, it would be the seat number that has the most people sitting in it.
- What's the smallest and largest value? Look at the first and last numbers on the number line that have dots above them. These tell you the range of your data.
What Stories Can Dot Plots Tell? Key Features to Look For
A dot plot doesn't just show numbers; it tells a story about your data. Here are some of the "story elements" you should look for:
1. The "Middle" (Center/Median) - Where's the Heart of the Data?
When you look at a dot plot, try to get a sense of where most of the dots are gathered. Where's the 'balancing point' if you were to pick it up? This is often called the center of the data.
Analogy: The Class Photo! Imagine all your classmates lined up for a photo, ordered by height. The person in the very middle of the line represents the "median" height. In a dot plot, if you were to count all the dots and find the middle dot's position, that value would be your median.
2. The "Spread" (Range) - How Wide is the Story?
This tells you how spread out your data is. Are all the dots clustered close together, or are they stretched far apart?
To find the range, you simply subtract the smallest value (the lowest number with a dot) from the largest value (the highest number with a dot). A small range means the data is tightly grouped; a large range means it's very spread out.
Analogy: Your Arm Span! If you measure the arm spans of everyone in your class, and the shortest is 1 meter and the longest is 1.5 meters, the range is 0.5 meters. If you measure the arm spans of students from kindergarten to high school, the range would be much larger because the data is more "spread out."
3. "Clusters" - Where are the Friends Hanging Out?
Sometimes, you'll see groups of dots piled up in one or more areas. These are called clusters. They show you where a lot of your data points are concentrated. For example, if you plot the number of hours students spend on homework, you might see a cluster around 1-2 hours and another cluster around 4-5 hours (maybe some students have more demanding subjects).
Analogy: Group Projects! When your teacher assigns group projects, students naturally form clusters or groups with their friends or people they work well with. These clusters represent a concentration of students in certain areas.
4. "Gaps" - Are There Any Empty Spaces?
A gap is an empty space on the number line where there are no dots. Gaps can be interesting because they tell you that no one in your data set had that particular value. If you had a gap between 2 pets and 5 pets, it means no one had 3 or 4 pets.
Analogy: Empty Seats on a Bus! Imagine looking at a bus. If there's a big empty space (a row with no one sitting in it) between groups of passengers, that's like a gap in a dot plot. It means for that particular "seat number" (value), there are no "passengers" (data points).
5. "Outliers" - The Lone Wolves!
Sometimes, you'll see a single dot, or a very small group of dots, way out by itself, far away from the main cluster of data. These are called outliers. They are values that are much higher or much lower than most of the other values.
Analogy: The Tallest Person in the Room! Imagine a group of 7th graders, and then a professional basketball player walks in. That basketball player's height would be an outlier – a value much, much taller than everyone else in the group.
Let's Look at an Example Dot Plot
To put all this together, let's imagine a dot plot showing the number of hours 7th graders spent reading last week. Take a look below:
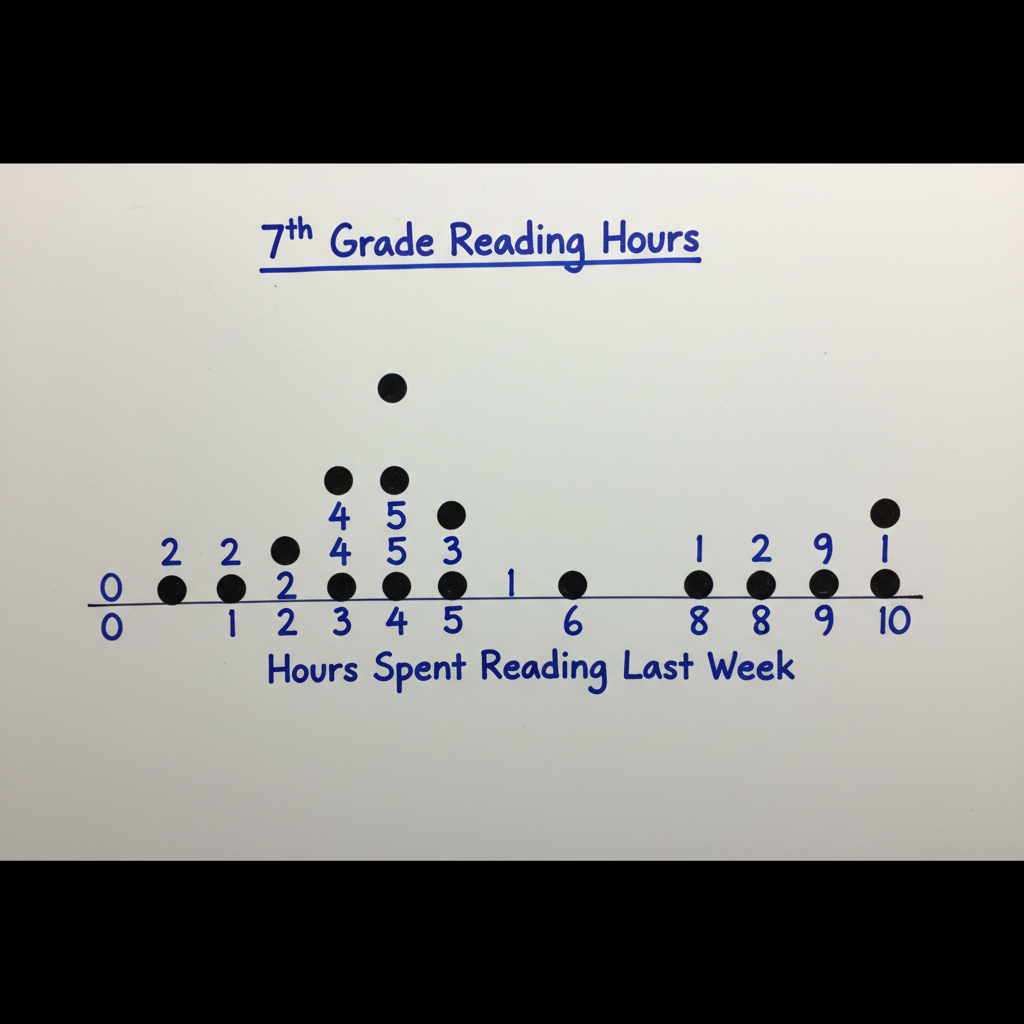
What can we learn from this dot plot?
- Title: "Hours Spent Reading Last Week by 7th Graders"
- Number Line Label: "Hours"
- Total Dots: (If we count the dots from the image description, there would be 1+2+4+3+2+1+1 = 14 dots for example, assuming 0 (1 dot), 1 (2 dots), 2 (4 dots), 3 (3 dots), 4 (2 dots), 5 (1 dot), 9 (1 dot) following the prompt's implied pattern for a cluster at 2-4, gap at 6, outlier at 9.) - So, 14 students shared their reading hours.
- Smallest Value: 0 hours (one student read 0 hours).
- Largest Value: 9 hours (one student read 9 hours).
- Range: 9 - 0 = 9 hours. (The reading times range by 9 hours.)
- Most Common (Mode): Let's say the tallest stack is above '2' with 4 dots. So, 2 hours was the most common reading time.
- Clusters: There's a clear cluster of dots between 2 and 4 hours. This tells us most students read between 2 and 4 hours.
- Gaps: There's a gap between 5 and 9 hours (specifically at 6, 7, and 8 hours). This means no student reported reading 6, 7, or 8 hours.
- Outliers: The single dot at 9 hours looks like an outlier. Most students read much less, so 9 hours is unusually high.
Putting It All Together: Your Dot Plot Analysis Checklist
When you see a dot plot, here's a simple checklist to help you analyze it:
- What is the Title and what do the Labels mean?
- How many total data points (dots) are there?
- What is the minimum (smallest) value and the maximum (largest) value?
- What is the range (maximum - minimum)?
- Where is the main cluster of data? What's the mode (tallest stack)?
- Are there any noticeable gaps in the data?
- Are there any outliers (dots far away from the main group)?
Dot plots are powerful tools for quickly understanding data. They help you see patterns, unusual values, and where most of the action is. Keep practicing, and you'll become a dot plot master in no time!
Keep learning, free
Create a free Syllabax account to unlock practice questions and games for this topic.
Visual Learning Enhanced! 🚀
To help you master this topic, we use Advanced Syllabax AI to generate detailed diagrams and visual models.
Note on Visuals: The AI sometimes makes spelling errors in image labels. Please refer to the lesson text for the correct terminology.