Introduction to Scatter Plots
Watch this topic in 60 seconds
Free preview · Lesson 1
Understanding Introduction to Scatter Plots
Introduction to Scatter Plots: Uncovering Relationships in Data!
Hey there, future data detectives! Have you ever wondered if there's a connection between two different things? Like, do students who spend more time studying usually get higher test scores? Or does the temperature outside affect how many ice cream cones are sold? These are the kinds of questions we can start to answer with something called a Scatter Plot!
What Exactly IS a Scatter Plot?
Imagine you have a bunch of individual data points, and you want to see if they follow a pattern. A scatter plot is like a special kind of graph that helps us do just that! Think of it as a treasure map where each 'X' isn't just one treasure, but a pair of related treasures.
In simpler terms, a scatter plot is a graph that uses dots (or points) to show the relationship between two different pieces of numerical information (variables). Each dot on the graph represents one 'observation' or 'event,' and it tells us two things about that event at the same time.
The X and Y Axes: Your Data's GPS
Just like other graphs you've seen, scatter plots have two main lines called axes:
- The X-axis (Horizontal Axis): This runs side-to-side (left to right). We usually put the independent variable here. Think of the independent variable as the thing you might change or the thing that happens first. It's like the cause or the input. For example, 'hours spent studying'.
- The Y-axis (Vertical Axis): This runs up and down. We usually put the dependent variable here. The dependent variable is the thing that might be affected by the independent variable. It's like the effect or the output. For example, 'test scores'.
So, if we were tracking 'hours studied' (X-axis) and 'test scores' (Y-axis), each dot would represent one student. If a student studied for 3 hours and got a score of 85, you'd find 3 on the X-axis, 85 on the Y-axis, and put a dot right where those two numbers meet!
Why Do We Use Scatter Plots? Uncovering Relationships!
The magic of scatter plots is that they help us see if there's a trend or connection between our two variables. We call this connection correlation. It's like looking for footprints in the sand – do they go in a straight line, zig-zag, or are they just all over the place?
Types of Correlation: What Story Do the Dots Tell?
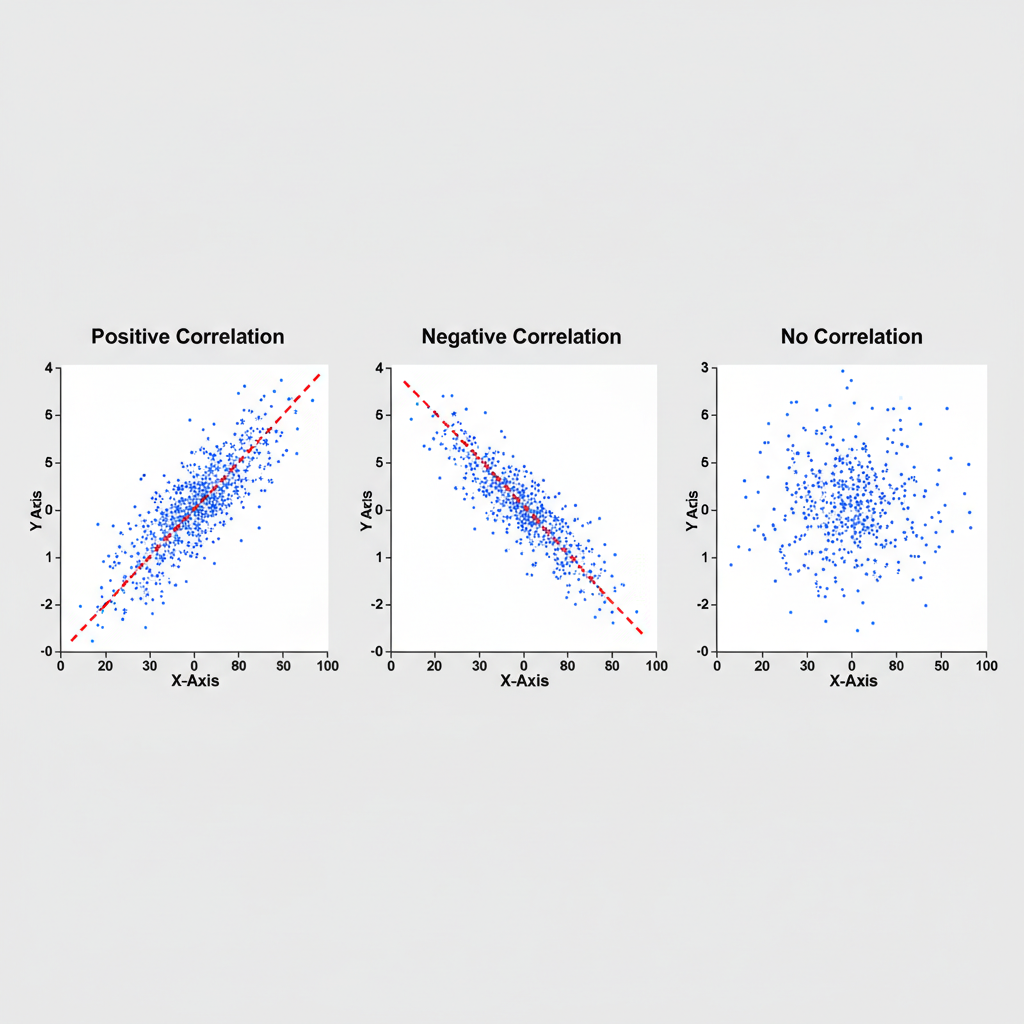
When you look at a scatter plot, the way the dots are arranged can tell you a lot about the relationship. There are three main types of correlation:
1. Positive Correlation: Moving Together!
Imagine you're climbing a hill. As you walk forward (increasing X), you also go higher (increasing Y). That's positive correlation! In a scatter plot, if the dots generally go from the bottom-left to the top-right, it means that as one variable increases, the other variable also tends to increase. They move in the same direction.
Analogy: Think about the amount of exercise you do and how strong your muscles get. Generally, the more you exercise (X), the stronger your muscles become (Y). Both go up!
2. Negative Correlation: Opposites Attract (or Repel)!
Now, imagine you're sliding down a slide. As you move forward (increasing X), you go lower (decreasing Y). That's negative correlation! In a scatter plot, if the dots generally go from the top-left to the bottom-right, it means that as one variable increases, the other variable tends to decrease. They move in opposite directions.
Analogy: Consider the number of hours you spend watching TV and your concentration level for homework. Often, the more hours you spend watching TV (X), the less focused you might be on your homework (Y). One goes up, the other goes down!
3. No Correlation: A Random Mess!
What if the dots are just scattered everywhere, like confetti after a party? If there's no clear pattern or direction, then there's likely no correlation between the two variables. One doesn't seem to affect the other in a predictable way.
Analogy: Think about a person's shoe size and their favorite color. Does having bigger feet (X) make you prefer blue over red (Y)? Probably not! There's no connection, and the dots on a scatter plot would look random.
Important Note: Correlation is NOT Causation!
This is a super important point, so pay close attention! Just because two things seem to move together (they're correlated) doesn't mean one *causes* the other. It's like seeing a lot of people wearing raincoats and also seeing a lot of puddles. The raincoats and puddles are correlated (they appear together), but the raincoats don't *cause* the puddles, and the puddles don't *cause* the raincoats. Rain causes both!
Analogy: Imagine during the summer, ice cream sales go up, and so do the number of shark attacks. Both are positively correlated (they both increase at the same time of year). But does eating ice cream *cause* shark attacks? Of course not! What's likely causing both is the warm weather – more people buy ice cream in warm weather, and more people swim in the ocean (where sharks are) in warm weather.
So, scatter plots are great for showing relationships, but they don't automatically tell us *why* those relationships exist. That requires more investigation!
Let's Summarize!
Scatter plots are powerful tools for visualizing how two sets of data relate to each other. By looking at the pattern of the dots, you can quickly get an idea of whether there's a positive, negative, or no correlation. Remember the axes, the points, and the important difference between correlation and causation, and you'll be well on your way to becoming a data wizard!
Keep learning, free
Create a free Syllabax account to unlock practice questions and games for this topic.
Visual Learning Enhanced! 🚀
To help you master this topic, we use Advanced Syllabax AI to generate detailed diagrams and visual models.
Note on Visuals: The AI sometimes makes spelling errors in image labels. Please refer to the lesson text for the correct terminology.