Learning Journey
Watch this topic in 60 seconds
Free preview · Lesson 1
Understanding Recognizing Misleading Statistics and Graphs
Decoding the Deception: Recognizing Misleading Statistics and Graphs (7th Grade)
Welcome, young detectives! Today, we're going to learn a superpower: the ability to spot when numbers and pictures are trying to trick us. Just like a magician uses clever moves to make you believe something isn't real, statistics and graphs can sometimes be used to make certain ideas seem more important or true than they actually are. But don't worry, by the end of this lesson, you'll be armed with the tools to become a super-sleuth of data!
What Are Statistics and Graphs, Anyway?
Before we talk about misleading ones, let's remember what statistics and graphs are for. They are tools that help us understand information (or 'data') about the world around us. Think of them as storytellers. Statistics tell stories using numbers, like "7 out of 10 students prefer pizza." Graphs tell stories using pictures, like bar charts or pie charts, to show how those numbers compare.
When used correctly, these tools are incredibly helpful! But sometimes, whether by accident or on purpose, they can tell a twisted version of the story. Our job is to learn how to identify these twisted tales.
Part 1: The Sneaky Secrets of Misleading Statistics
Statistics are numbers, but how they are collected, used, or presented can be tricky. Let's look at some common ways numbers can be used to mislead.
1. The Biased Sample: Asking Only One Side
Imagine you want to know if students at your school like the new lunch menu. If you only ask your friends who already told you they hate everything, you're not going to get a fair idea! This is called a biased sample. A sample is a small group picked to represent a larger group. If the sample isn't chosen fairly, the results will be biased (leaning one way) and won't accurately represent the whole group.
- Analogy: It's like trying to find out what everyone in your town thinks about a new park, but you only ask people who live right next to the park and love it. You're missing out on the opinions of everyone else! A fair (unbiased) sample would try to ask people from all over town.
2. The Small Sample Size: Not Enough Voices
Even if you ask people fairly, if you don't ask enough people, your results might not mean much. If you ask only three students about the new lunch menu and two say it's great, can you really say "66% of students love the new menu"? Probably not, because three students is a very small number compared to a whole school!
- Analogy: If you're trying to figure out if a new video game is fun, and you only ask two of your friends, their opinions might not be enough to decide if everyone will like it. You need a larger group of opinions to get a good idea.
3. Cherry-Picking Data: Showing Only the Good Parts
Imagine a student gets excellent grades in math and science, but struggles in history and English. If they only show their parents their math and science report cards, they are "cherry-picking" the data. This means they are only presenting the information that supports their point (that they are a good student) and hiding the rest.
- Analogy: A company might advertise that "9 out of 10 doctors recommend our toothpaste!" but they might have only surveyed 10 doctors and ignored hundreds of others who didn't recommend it, or they might have paid those doctors. They only picked the "cherries" (the good results).
4. Confusing Correlation with Causation: Just Because They Happen Together...
This is a big one! Sometimes, two things happen at the same time, or they seem to be related, but one doesn't actually cause the other. For example, ice cream sales and shark attacks both tend to increase in the summer. Does eating ice cream cause shark attacks? Of course not! The real cause for both is summer weather (more people swimming, more people eating ice cream).
- Analogy: Just because you wear your lucky socks and your favorite sports team wins doesn't mean your socks caused them to win. They just happened at the same time. Don't confuse a friendship with a bossy relationship!
5. Misleading Averages: Choosing the "Best" Number
There are different ways to calculate an "average" (like mean, median, and mode). Depending on the numbers, one average might make a situation look better or worse than another. For example, if a company has one CEO who makes millions and all other employees make minimum wage, the mean average salary (adding all salaries and dividing by the number of people) would look very high. But the median average (the middle salary if all salaries were listed from lowest to highest) would be much lower and probably more representative of what most employees earn.
- Analogy: Imagine a classroom where one student scored 100 on a test, and everyone else scored 50. The mean average would be higher than 50. But the median (the score in the middle) would be 50, which tells a different story about what most students achieved.
Part 2: The Art of Deceptive Design: Misleading Graphs
Graphs are visual storytellers, but they can be designed in ways that twist the story, making small differences look huge or big differences look tiny.
1. The Truncated Y-Axis (or Non-Zero Baseline): Making Molehills into Mountains
This is one of the most common tricks! A graph's y-axis (the vertical line that usually shows the quantity or amount) should ideally start at zero. If it starts at a higher number, even tiny differences between bars or lines can look enormous. It's like measuring how much you've grown starting your ruler at 3 feet instead of 0!
- Analogy: Imagine a bar graph showing two companies' sales. Company A sold 90 items, and Company B sold 95 items. If the graph's y-axis starts at 85 instead of 0, the bar for Company B will look three times taller than Company A's bar, even though it only sold 5 more items! This makes a small difference seem like a huge victory for Company B.
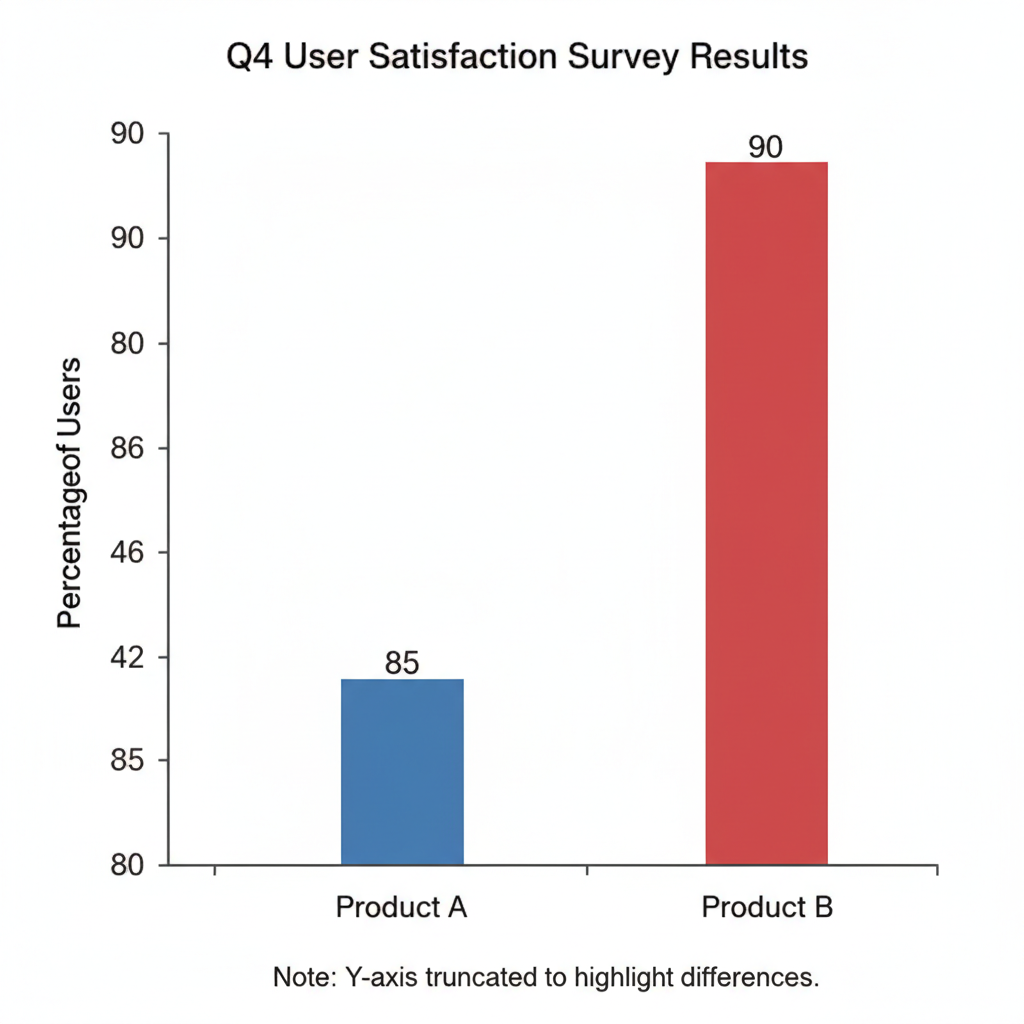 ⚠️ This picture may have spelling mistakes. Trust the words in the lesson.
2. Manipulating the Scale: Stretching and Squishing
Graph makers can change how "stretched" or "squished" the numbers on the axes are. If they make the intervals on the y-axis very small (e.g., 1, 2, 3), a small change will look like a huge jump. If they make the intervals very large (e.g., 100, 200, 300), a big change will look like hardly anything happened.
- Analogy: Imagine you're drawing a picture of your cat. If you stretch the paper sideways, your cat will look much wider than it really is. If you squish it, the cat looks very thin. Graphs can do the same with data, making trends appear more or less dramatic.
3. Omitting Data or Incomplete Data: The Missing Pieces
Sometimes, a graph might just leave out important information that would change your understanding. Maybe a graph shows a company's profit rising over 5 years, but it only shows the profits from years when the company was doing well, skipping a year when they lost money.
- Analogy: It's like showing only half of a treasure map. You might find some gold, but without the other half, you're missing the full picture and might miss the biggest treasure!
4. Using Inappropriate Graph Types: The Wrong Tool for the Job
Certain types of graphs are better for certain types of data. For example, a pie chart is great for showing parts of a whole (like percentages that add up to 100%). If someone uses a pie chart where the percentages don't add up to 100%, or to show how something changes over time (which is better for a line graph), it can be confusing or misleading.
- Analogy: Trying to hammer a nail with a screwdriver. You're using a tool, but it's the wrong tool for the job, and the result won't be good.
How to Be a Statistic Detective: Your Superpower Guide!
Now that you know the tricks, here's how to protect yourself and others from misleading data:
- Look at the Source: Who created this statistic or graph? Do they have a reason to want you to believe something specific? (e.g., a company selling a product vs. a university study).
- Check the Axes: Does the y-axis (the vertical one) start at zero? What are the intervals on both axes? Are they consistent?
- Read the Labels: What do the numbers and categories actually represent? Are there any missing labels?
- Consider the Sample: How many people were surveyed? How were they chosen? Is it a fair representation?
- Look for Missing Information: Is there any data that seems to be left out? Does the graph show the whole picture?
- Think Critically: Does this really make sense? Do the numbers and visuals match the conclusion being drawn?
Conclusion
In our world, numbers and graphs are everywhere – in news, advertisements, social media, and even school projects. Learning to recognize when they are misleading is a vital skill that helps you make better decisions, understand information more clearly, and not be easily fooled. Keep practicing your detective skills, and you'll become an expert at spotting the truth behind the data!
Keep learning, free
Create a free Syllabax account to unlock practice questions and games for this topic.
Visual Learning Enhanced! 🚀
To help you master this topic, we use Advanced Syllabax AI to generate detailed diagrams and visual models.
Note on Visuals: The AI sometimes makes spelling errors in image labels. Please refer to the lesson text for the correct terminology.