Learning Journey
Free preview · Lesson 1
Understanding Making Simple Graphs
Making Simple Graphs: Your Visual Storytellers for Numbers!
Hey super learners! Have you ever tried to tell a story with pictures instead of just words? Or maybe you've tried to compare which tower of blocks is taller without using a ruler? Well, that's exactly what graphs help us do with numbers and information!
What is a Graph, Anyway?
Imagine you have a bunch of toys. If you just dump them all on the floor, it's hard to see what you have, right? But if you sort them into piles – like cars, dolls, and puzzles – it's much easier to see how many of each you have. A graph is like that super-tidy way of organizing information so we can see it clearly and understand it quickly!
Think of a graph as a special kind of picture that shows us information. It helps us compare things and answer questions without having to read a long list of numbers. It makes numbers tell a visual story!
Why Do We Use Graphs?
Graphs are like secret helpers for your brain! They help us:
- See things easily: Instead of looking at a list of numbers like "5 apples, 3 bananas, 7 oranges," a graph can show you in a quick peek which fruit is most popular.
- Compare things quickly: Which team scored more points? Which month had more sunny days? Graphs show us these comparisons right away.
- Understand information better: They turn boring numbers into exciting pictures!
Let's Meet Our First Graph Friend: The Pictograph!
The word "pictograph" is a clue! "Picto" sounds like picture, right? And that's exactly what a pictograph does: it uses pictures or symbols to show information. It's like drawing little emojis to represent numbers!
How Does a Pictograph Work? (Like a Sticker Chart!)
Imagine your teacher gives you a sticker every time you read a book. At the end of the month, you look at your sticker chart. You can quickly see how many books you read by counting the stickers! A pictograph works just like that.
Parts of a Pictograph:
- Title: This tells us what the graph is about. (Example: "Our Class's Favorite Animals").
- Categories: These are the different things we are comparing. (Example: Dogs, Cats, Fish).
- Pictures/Symbols: These are the little drawings that stand for the numbers. Each picture usually means a certain amount.
- Key (or Legend): This is super important! The key tells us what each picture means. It's like the secret code for the graph. For example, if the key says "Each = 1 student," then every dog picture means one student. Sometimes, one picture might mean 2 or even 5 things!
Let's look at an example:
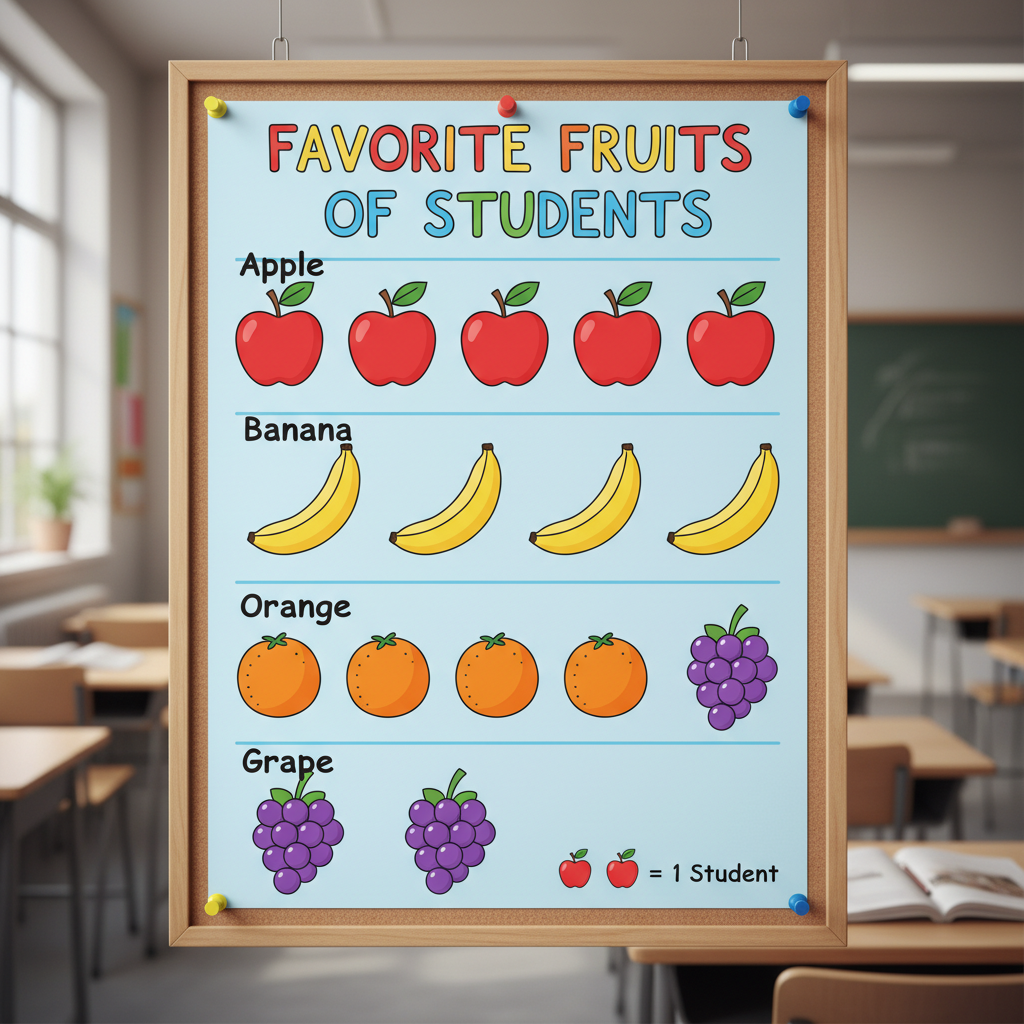
In this pictograph, if the key says "Each apple symbol = 1 student," you can easily count how many students like apples, bananas, oranges, and grapes by counting the little apple symbols in each row!
How to Make a Pictograph:
- Pick a Topic: What information do you want to show? (Like favorite colors, or types of pets).
- Collect Data: Ask your friends or classmates questions to get the information.
- Choose Your Pictures: What symbol will you use? (If it's about pets, maybe a paw print or a little animal drawing).
- Make a Key: Decide what each picture will stand for. (Most of the time for simple graphs, one picture means one thing).
- Draw Your Graph: Give it a title, list your categories, and draw the correct number of pictures for each category, following your key!
Now, Let's Meet Our Second Graph Friend: The Bar Graph!
A bar graph uses bars (like tall towers!) to show information. These bars can go up and down (vertical) or side to side (horizontal). Just like pictographs, bar graphs help us compare different amounts.
How Does a Bar Graph Work? (Like Comparing Towers of Blocks!)
Imagine you and your friend are building block towers. You build a tower of 5 blocks, and your friend builds a tower of 7 blocks. By just looking, you can tell whose tower is taller, right? That's how a bar graph works! The taller the bar, the more of something there is.
Parts of a Bar Graph:
- Title: Tells us what the graph is about (Example: "Number of Sunny Days Each Month").
- Labels for Axes: A bar graph has two main lines, like a giant "L" shape. These lines are called "axes" (say: AX-eez).
- One axis (often the one along the bottom, called the X-axis) lists the categories (Example: Months like January, February, March).
- The other axis (often the one going up the side, called the Y-axis) shows the numbers or amounts (Example: Number of Sunny Days: 0, 1, 2, 3...). This axis usually has a scale, like counting by 1s, 2s, or 5s.
- Bars: These are the colorful rectangles! The height (or length) of each bar shows the amount for that category.
Let's look at an example:
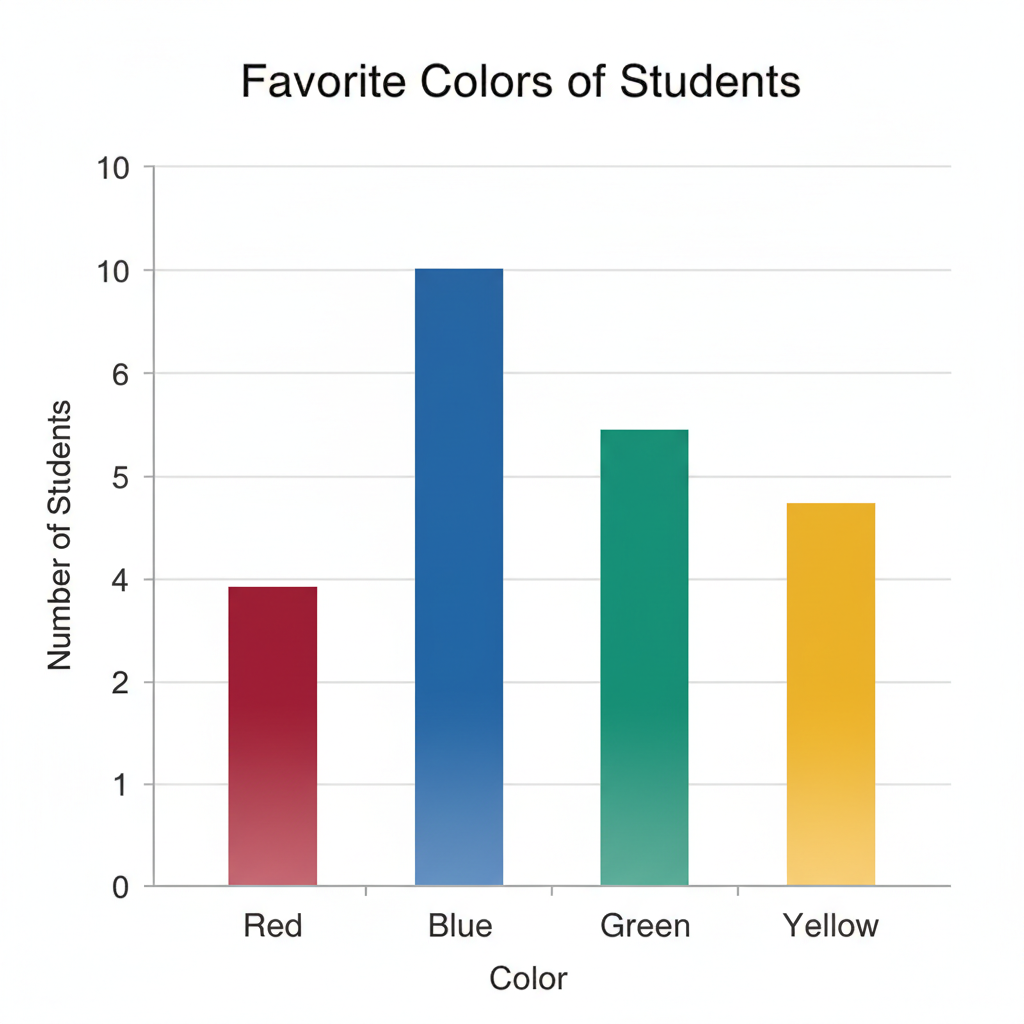
In this bar graph, you can quickly see which color is most popular by finding the tallest bar! If the blue bar goes up to the number 8, it means 8 students like blue.
How to Make a Bar Graph:
- Pick a Topic and Collect Data: Same as with pictographs!
- Draw Your Axes: Draw the "L" shape.
- Label Your Axes: Write your categories on one axis (like "Colors") and your numbers/amounts on the other axis (like "Number of Students"). Make sure your numbers go up in a steady way (like 0, 1, 2, 3, or 0, 2, 4, 6).
- Draw Your Bars: For each category, draw a bar up to the correct number on the number axis. Make sure all your bars are the same width!
- Give it a Title: Don't forget to tell everyone what your awesome graph is about!
Pictographs vs. Bar Graphs: Which one to choose?
Both pictographs and bar graphs are great for showing information, but they do it in slightly different ways:
- Pictographs: Are fun and easy to understand because they use pictures! They're great when you want to show small amounts or make it very visual. Remember the key is super important here!
- Bar Graphs: Are good for comparing amounts more precisely, especially when the numbers are larger. The height of the bar directly shows the number, which can be very clear.
It's like choosing between telling a story with lots of small drawings (pictograph) or with a few big, clear block towers (bar graph)! Both work, but sometimes one is a better fit than the other.
You Are Now a Graph Detective!
When you see a graph, you're not just looking at lines and pictures – you're looking at a story the numbers are telling! Ask yourself:
- What is the title?
- What are the different things being compared?
- What do the pictures or bars tell me?
- What is the key or scale telling me?
- Which category has the most? Which has the least?
Graphs help us make sense of the world around us, from how many people like pizza to how many sunny days we had last month. Keep practicing, and you'll be a graph expert in no time!
Keep learning, free
Create a free Syllabax account to unlock practice questions and games for this topic.
Visual Learning Enhanced! 🚀
To help you master this topic, we use Advanced Syllabax AI to generate detailed diagrams and visual models.
Note on Visuals: The AI sometimes makes spelling errors in image labels. Please refer to the lesson text for the correct terminology.