Misleading Averages
Watch this topic in 60 seconds
Free preview · Lesson 1
Understanding Misleading Averages
Understanding Misleading Averages: Don't Get Fooled by Numbers!
Hey there, future super-sleuths of data! Have you ever heard someone say, "On average, students in this class score really high!" or "The average salary at our company is amazing!" and thought, "Hmm, is that really true for *everyone*?" If so, you're already on your way to becoming a critical thinker about numbers!
Today, we're going to uncover a secret: averages, while super useful, can sometimes be a bit sneaky. They can accidentally (or sometimes on purpose!) paint a picture that isn't quite the whole truth. We call this "misleading averages." Don't worry, by the end of this, you'll be a pro at spotting them!
What Exactly IS an Average, Anyway? (It's Not Just One Thing!)
When most people say "average," they usually think of one specific type. But guess what? There are actually THREE main types of averages that mathematicians and statisticians use. Think of them like three different ways to summarize a group of numbers. Each one tells you something slightly different.
1. The Mean: The "Fair Share" Average
This is the average you're probably most familiar with. It's what you get when you add up all the numbers in a group and then divide by how many numbers there are. Think of it like this:
- Analogy: Sharing Candies. Imagine you and your friends have a bunch of candies. One friend has 10, another has 5, and you have 3. If you wanted to share them *equally* so everyone has the same amount, you'd collect all the candies (10 + 5 + 3 = 18) and then divide them by the number of friends (3 friends). So, 18 / 3 = 6 candies each. The "mean" number of candies is 6.
The mean tries to find the 'balance point' or the 'fair share' if everything were distributed evenly.
2. The Median: The "Middle Person" Average
The median is the middle number in a set of data when those numbers are arranged in order from smallest to largest. It's like finding the exact center of a line.
- Analogy: Lining Up by Height. Imagine all the students in your class line up from shortest to tallest. The person standing exactly in the middle of that line represents the median height of the class. Half the students are shorter than them, and half are taller.
- If there's an even number of data points, you'd find the two middle numbers and calculate their mean (add them up and divide by 2).
The median tells you what the "typical" value is, specifically the one that divides the data set into two equal halves.
3. The Mode: The "Most Popular" Average
The mode is the number that appears most often in a set of data. It's all about what's popular or frequent!
- Analogy: Favorite Colors. If you ask everyone in your class their favorite color, and most people say "blue," then "blue" is the mode of favorite colors. It's the most frequently chosen option.
- A dataset can have one mode (unimodal), more than one mode (bimodal, trimodal, etc.), or no mode at all if all numbers appear with the same frequency.
The mode helps us understand which value is most common.
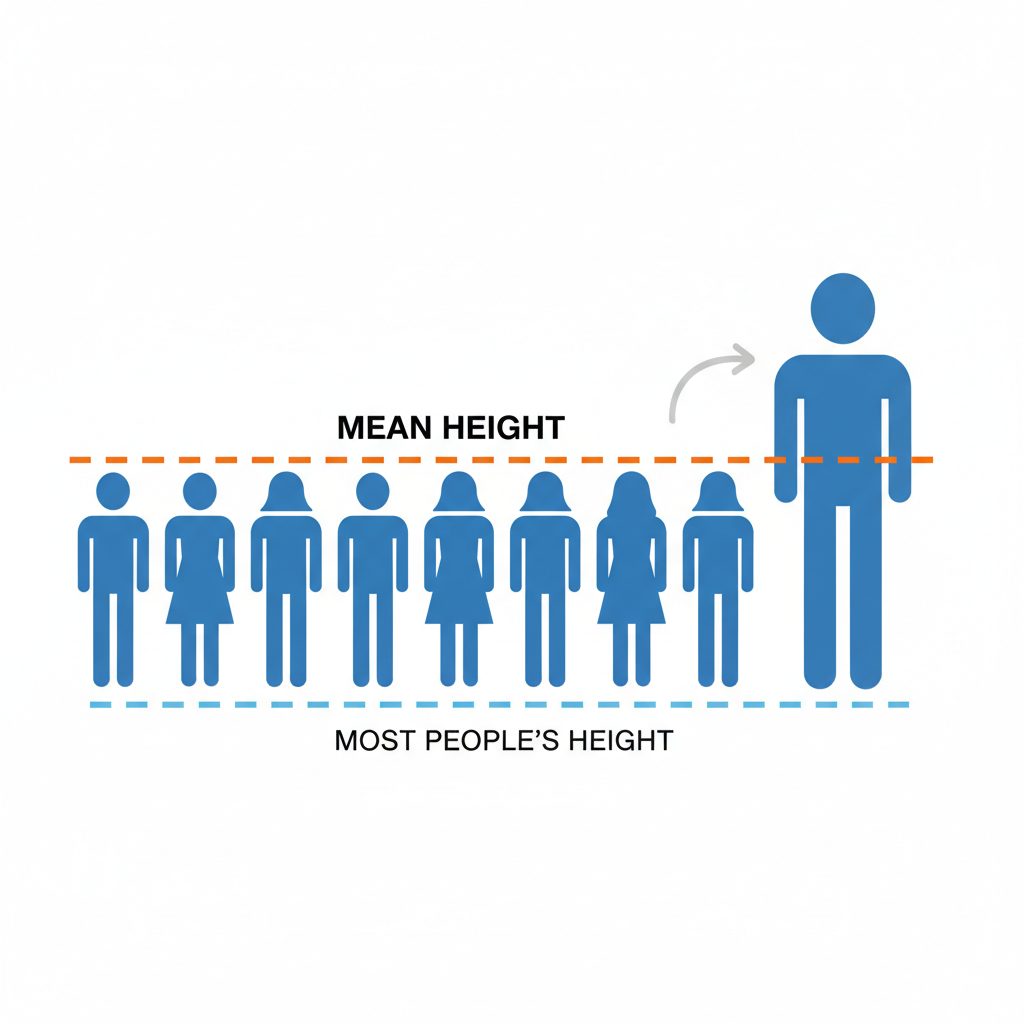
When Averages Play Tricks: How They Can Be Misleading
Now that we know there are different types of averages, let's look at how they can sometimes trick us. Understanding these tricks is key to not being fooled!
Trick #1: The Power of Outliers (Especially for the Mean!)
An "outlier" is a number in your data set that is extremely different from all the other numbers. It's like having a tiny ant marching with a giant elephant – the elephant is the outlier! Outliers can *drastically* pull the mean average in their direction, making it seem like the typical value is much higher or lower than it actually is for most of the group.
- Analogy: The Millionaire Next Door. Imagine you're in a neighborhood with 9 families, and each family earns about
- If you calculate the mean income for all 10 families, it would look incredibly high, maybe close to a million dollars! But does that mean the "average" family in the neighborhood is super rich? No! 9 out of 10 families are still earning $50,000. The millionaire is an outlier making the mean misleading.
- The median income, however, would still be around $50,000, which is a much better representation of the typical family's income in that neighborhood.
This is a classic example where the mean gets pulled by an extreme value, while the median stays stable and provides a more accurate picture of the 'middle ground'.
Trick #2: Skewed Data (When Things Aren't Evenly Spread)
Sometimes, data isn't spread out nicely and evenly. It might be "skewed," meaning most of the numbers are clustered on one side, with a long "tail" of numbers stretching in the other direction. When data is skewed, the mean, median, and mode can all be different, and some might be more representative than others.
- Analogy: Test Scores. Imagine a really hard test where most students scored low (like 30s and 40s), but a few super-smart students scored perfectly (100s).
- The mode might be 35 (most common score).
- The median might be 45 (the middle score).
- The mean would be higher, perhaps 60, pulled up by those high scores.
Trick #3: Small Sample Sizes (Don't Judge a Book by One Page!)
A "sample size" is simply the number of items or people you've collected data from. If you have a very small sample size, your average might not represent the larger group at all.
- Analogy: Tasting One Apple. If you want to know if a whole barrel of apples is sweet, would you taste just one apple and decide? Probably not! That one apple might be extra sweet or extra sour compared to the rest. You'd want to taste a few more to get a better "average" idea of the barrel's sweetness.
Averages from small samples are often unreliable. They can accidentally highlight unusual situations rather than the common trend.
Trick #4: Cherry-Picking the Average (Choosing What Sounds Best)
Sometimes, people know there are different types of averages, and they deliberately choose the one that makes their argument sound better. This is called "cherry-picking."
- Analogy: The Toy Store Owner. A toy store owner wants to show how successful their store is. They have 10 employees: 9 sales associates earning
- The mean salary is (
- However, the median salary is
- The mean salary is (
How to Become an Average-Spotting Detective!
Don't worry, you don't need a magnifying glass! Just keep these simple questions in mind whenever you hear an "average" being tossed around:
- Which average are they talking about? Is it the mean, median, or mode? If they don't say, ask!
- Are there any extreme values (outliers) that might be skewing the mean? If you see one number that's way off, it's a red flag.
- How many data points were used? Was it a big enough sample to be reliable, or just a few examples?
- What's the *purpose* of showing this average? Is someone trying to convince me of something?
By asking these questions, you'll start to see beyond just the number and understand the full story behind the average. You'll become a much smarter consumer of information!
Conclusion: Averages Are Tools, Not Always the Whole Story
Averages are incredibly powerful tools for summarizing lots of information into a single, easy-to-understand number. They help us make sense of complex data quickly. However, like any tool, they can be used poorly or even deceptively. Your job, as an informed learner, is to understand the different types of averages and to be curious about the context behind the numbers. Don't let a single average mislead you – dig a little deeper, and you'll find the real truth!
Keep learning, free
Create a free Syllabax account to unlock practice questions and games for this topic.
Visual Learning Enhanced! 🚀
To help you master this topic, we use Advanced Syllabax AI to generate detailed diagrams and visual models.
Note on Visuals: The AI sometimes makes spelling errors in image labels. Please refer to the lesson text for the correct terminology.