Experimental Probability
Watch this topic in 60 seconds
Free preview · Lesson 1
Understanding Experimental Probability
Exploring Experimental Probability: Learning from What Happens!
Welcome, 10th-grade explorers, to the fascinating world of probability! Think about it: every day, we make educated guesses about what might happen. Will it rain tomorrow? Will my favorite team win? Will I ace this math test?
In math, probability is all about quantifying this uncertainty – giving it a number. But there are two main ways we can think about probability: Theoretical Probability (what should happen based on perfect conditions) and Experimental Probability (what actually does happen when we try it out).
Theoretical Probability: The Ideal World (A Quick Look)
Before diving deep into experimental probability, let's briefly touch upon its cousin, theoretical probability. Imagine you have a fair coin. What's the chance of getting heads? You'd probably say 1 out of 2, or 50%. Why? Because there are two equally likely outcomes (heads or tails), and one of them is heads. This is theoretical probability – it's based on what should happen in an ideal scenario, without actually flipping the coin.
The formula for theoretical probability is: P(Event) = (Number of favorable outcomes) / (Total number of possible outcomes).
Introducing Experimental Probability: Learning from Experience!
Now, let's shift our focus to experimental probability. This is where the rubber meets the road! Experimental probability is all about doing an experiment, observing the results, and then using those results to predict what might happen in the future. It's like being a scientist, running tests and collecting data.
Think of it this way: Instead of just thinking about a coin, you actually flip it 100 times and record whether you get heads or tails. If you got heads 48 times, then your experimental probability of getting heads would be 48 out of 100. It's based on real-world observations, not just what we expect.
The Core Idea: Trials and Outcomes
- Trial: Each time you perform the experiment. If you flip a coin, one flip is one trial. If you roll a die, one roll is one trial.
- Outcome: The result of a single trial. Getting a 'Heads' is an outcome. Rolling a '3' is an outcome.
- Event: A specific outcome or a set of outcomes that you are interested in. Getting 'Heads' is an event. Rolling an 'even number' (2, 4, or 6) is an event.
- Frequency: How many times a specific event occurred during your experiment. If you got heads 48 times in 100 flips, 48 is the frequency of the 'Heads' event.
The Formula for Experimental Probability
Calculating experimental probability is straightforward. Here's the simple formula:
P(Event) = (Number of times the event occurred) / (Total number of trials)
Let's use an analogy: Imagine you're a quality control inspector at a factory that makes light bulbs. You test 1,000 light bulbs (these are your trials). You find that 20 of them are defective (this is the frequency of the 'defective bulb' event).
The experimental probability of a light bulb being defective would be: 20 / 1000 = 0.02 or 2%.
Why is Experimental Probability Important? Real-World Applications!
Experimental probability is incredibly useful because the real world isn't always 'ideal' or 'fair'.
- Sports Statistics: A baseball player's batting average is an experimental probability! If a player gets 30 hits in 100 times at bat, their experimental probability of getting a hit is 30/100 or 0.300.
- Weather Forecasts: Meteorologists use past weather patterns (experimental data) to predict the chance of rain or snow for tomorrow.
- Medicine: When a new drug is tested, researchers look at how many patients get better out of the total number treated. This is experimental probability in action, helping them understand the drug's effectiveness.
- Manufacturing: Companies use it to predict how many products might be defective in a large batch, just like our light bulb example.
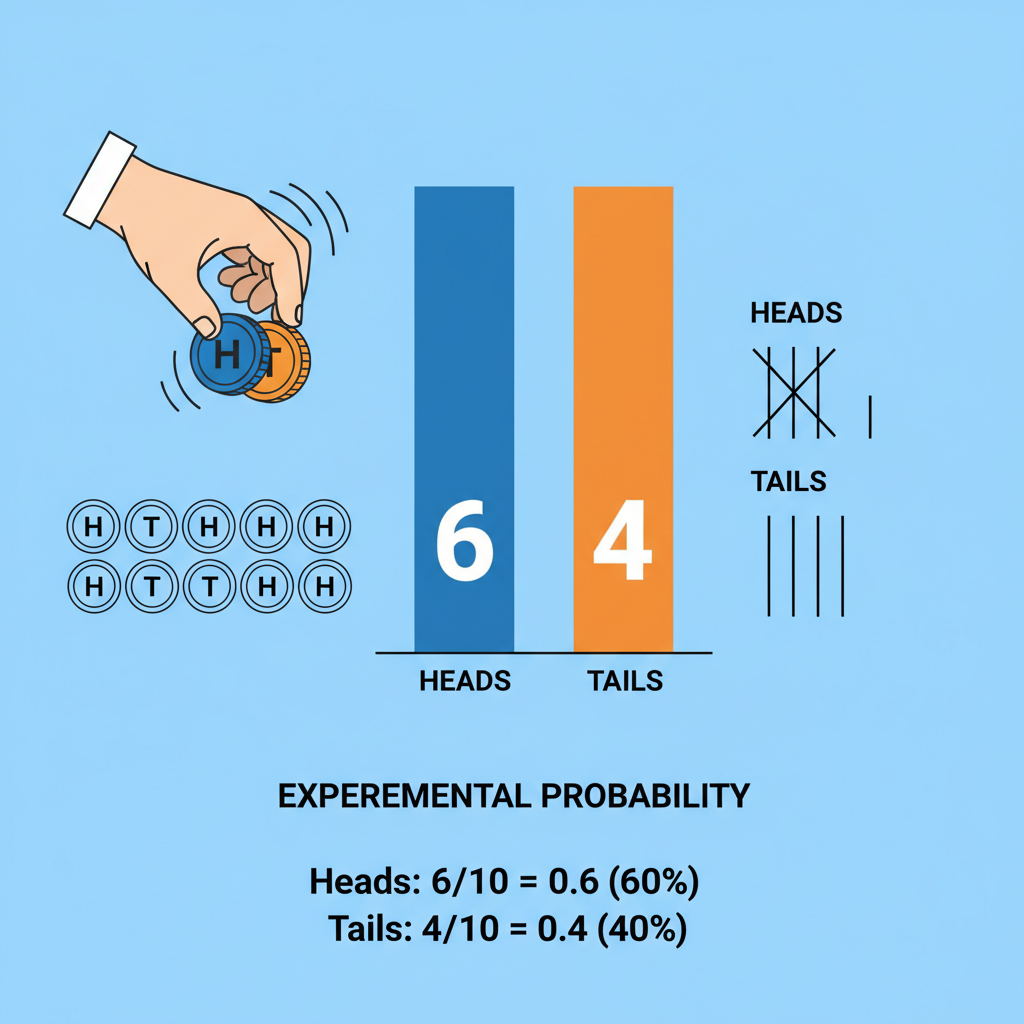 ⚠️ This picture may have spelling mistakes. Trust the words in the lesson.
Comparing Theoretical vs. Experimental Probability
It's important to understand the relationship between these two types of probability.
- Small Number of Trials: If you flip a coin only 5 times, you might get 4 heads and 1 tail. The experimental probability of heads (4/5 or 80%) is very different from the theoretical (1/2 or 50%). This is perfectly normal!
- The Law of Large Numbers: This is a super important concept! It states that the more trials you perform in an experiment, the closer your experimental probability will get to the theoretical probability. If you flip that coin not 5 times, but 500 times, or 5,000 times, you'll likely see the number of heads get much closer to 50% of the total flips. The 'quirks' of a few trials tend to even out over many trials.
Think of it like target practice. With just a few shots, your average might be off. But with hundreds of shots, your average hit rate will give a much more accurate picture of your true skill (which is like the theoretical probability).
Let's Try an Example Together!
Imagine you have a bag with different colored marbles. You want to find the experimental probability of drawing a blue marble.
- Perform Trials: You reach into the bag, pull out a marble, record its color, and put it back (this is called 'with replacement'). You do this 50 times.
- Record Results: Out of 50 trials, you note that you drew a blue marble 15 times.
- Calculate:
- Number of times the event (drawing a blue marble) occurred = 15
- Total number of trials = 50
- Experimental P(Blue Marble) = 15 / 50 = 3/10 = 0.3 or 30%.
So, based on your experiment, there's a 30% chance of drawing a blue marble from that bag.
Conclusion: Your Data, Your Predictions!
Experimental probability is a powerful tool for understanding and making predictions in the real world. It teaches us to learn from observation and data, rather than just relying on ideal expectations. The more data we gather, the more reliable our predictions become. So next time you see a statistic or a forecast, remember the scientists and data collectors who performed countless 'trials' to give us that valuable information!
Keep learning, free
Create a free Syllabax account to unlock practice questions and games for this topic.
Visual Learning Enhanced! 🚀
To help you master this topic, we use Advanced Syllabax AI to generate detailed diagrams and visual models.
Note on Visuals: The AI sometimes makes spelling errors in image labels. Please refer to the lesson text for the correct terminology.