Bar Graphs and Pictograms
Watch this topic in 60 seconds
Free preview · Lesson 1
Understanding Bar Graphs and Pictograms
Unlocking Data: Bar Graphs and Pictograms – Your Visual Storytellers!
Hey there, future data detectives! Have you ever looked at a bunch of numbers and felt your brain start to fog up? It's like trying to read a very long, boring instruction manual. What if there was a way to make those numbers exciting, easy to understand, and even fun? That's exactly what we're going to learn today! We're diving into the world of Bar Graphs and Pictograms – two super cool tools that turn boring numbers into engaging visual stories.
Why Do We Need Visuals for Data? (The Storytelling Analogy)
Imagine you want to tell your friend about your awesome trip to the zoo. You could list every animal you saw, how many of each, and what they did. "I saw 3 lions, 5 monkeys, 2 elephants, 4 giraffes..." Pretty soon, your friend's eyes might start to glaze over. But what if you showed them a picture of the lion, a quick video of the monkeys playing, or even just pointed at a drawing of an elephant? Suddenly, the story comes alive! That's exactly what graphs and pictograms do for numbers. They take raw data and turn it into a picture, making it easier and faster for our brains to understand.
Part 1: The Mighty Bar Graph – Building Blocks of Data
What is a Bar Graph? (The City Skyline Analogy)
A Bar Graph is like a city skyline built with data! Imagine each building in the skyline represents a different category (like types of snacks, months of the year, or favorite colors), and the height of each building tells you 'how much' or 'how many' of that category there is. Taller buildings mean more, shorter buildings mean less.
In more formal terms, a bar graph uses rectangular bars of different heights or lengths to show and compare different categories of data. The bars can be drawn vertically (up and down) or horizontally (sideways).
Key Parts of a Bar Graph: (The Map Analogy)
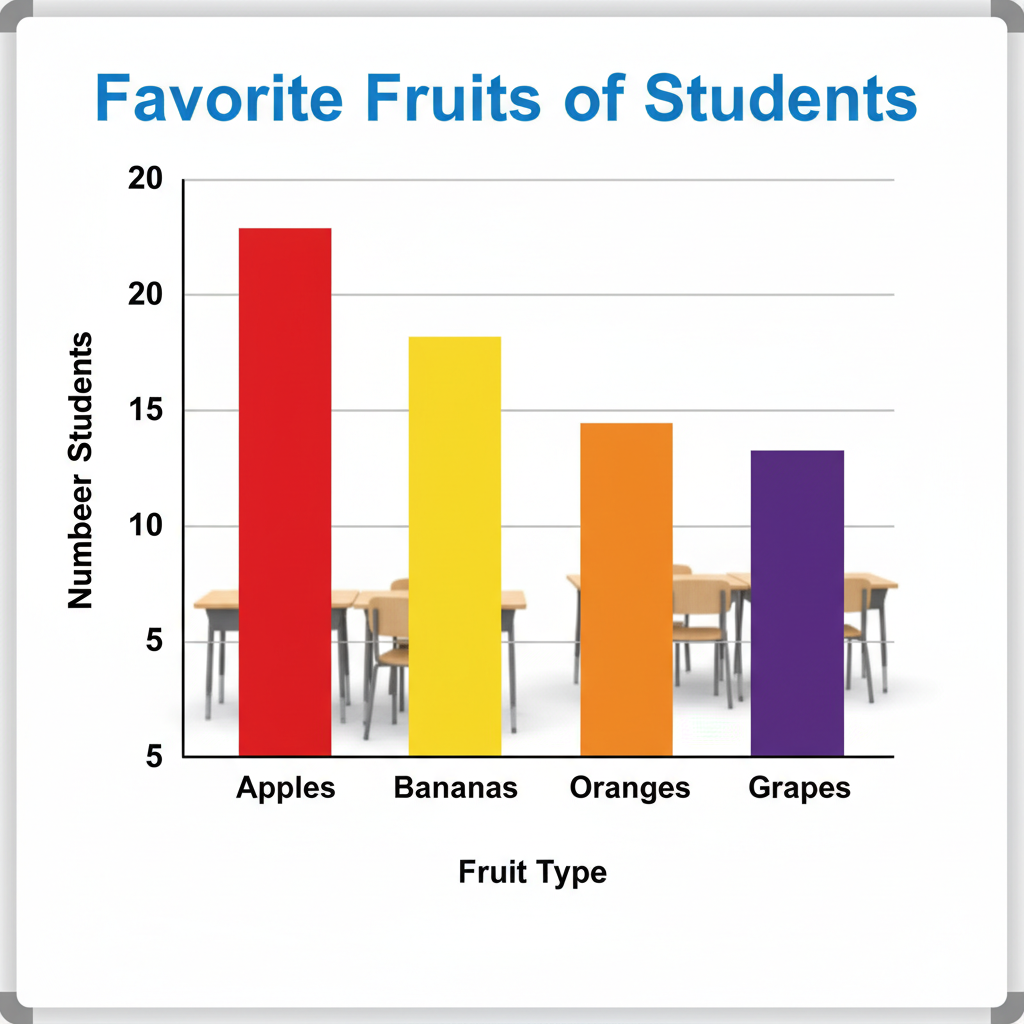
Just like a map has a compass, a legend, and street names, a bar graph has several important parts that help us understand the data:
- Title: This is like the name of the map. It tells you exactly what the graph is about (e.g., 'Favorite Sports of Grade 10 Students').
- X-axis (Category Axis): This is the horizontal line at the bottom. Think of it as the 'what' or 'who' we are comparing. If you're comparing favorite colors, the X-axis would list 'Red,' 'Blue,' 'Green,' etc.
- Y-axis (Value/Frequency Axis): This is the vertical line on the left side. Think of it as the 'how many' or 'how much.' It has numbers (a scale) that tell you the amount or frequency for each category. For example, it might go from 0 to 100, showing the number of students.
- Bars: These are the colorful rectangles! Their height (if vertical) or length (if horizontal) directly corresponds to the value on the Y-axis.
- Scale: These are the evenly spaced numbers along the Y-axis. It's like a ruler. Each jump (e.g., from 0 to 10, then 10 to 20) represents a consistent amount. Choosing a good scale is important so your bars aren't too squished or too spread out.
 ⚠️ This picture may have spelling mistakes. Trust the words in the lesson.
How to Read a Bar Graph: (The Detective Work)
- Read the Title: What information is the graph trying to show?
- Look at the Axes Labels: What do the X-axis and Y-axis represent?
- Understand the Scale: How much does each mark on the Y-axis represent? (e.g., each line could be 5 students, or 10 units).
- Examine the Bars: For each bar, find its category on the X-axis, then look across to the Y-axis to see its value. Which bar is tallest? Which is shortest? What does that tell you?
When to Use a Bar Graph:
Bar graphs are fantastic when you want to compare different categories of items or track changes over time. For instance, comparing the sales of different products, showing the number of students in various clubs, or illustrating monthly rainfall amounts.
Part 2: The Picture-Perfect Pictogram – Data with Symbols
What is a Pictogram? (The Emoji Analogy)
Imagine telling a story using only emojis! That's kind of what a Pictogram (also called a pictograph) does. Instead of plain bars, pictograms use pictures or symbols to represent data. Each symbol stands for a certain number of items. It's a fun and often very intuitive way to display data, especially for younger audiences or when you want a quick visual impact.
Key Parts of a Pictogram: (The Secret Code Analogy)
A pictogram also has its own special parts, much like a secret code needs a key to be understood:
- Title: Just like a bar graph, it tells you the topic.
- Categories: These are the different items or groups being compared, usually listed on one side (like the X-axis of a bar graph).
- Symbols/Pictures: These are the actual drawings or icons used to represent the data. For example, if you're showing favorite fruits, you might use an apple icon.
- Key/Legend: This is the MOST important part of a pictogram! It's like the decoder ring for your secret code. The key tells you what one symbol is worth. For example, 'Each 🍎 = 5 students.' Without the key, you can't understand the pictogram at all!
How to Read a Pictogram: (The Decoding Process)
- Read the Title: Understand the main subject.
- Find the Key/Legend: This is your first stop! How much does EACH symbol represent? This is critical!
- Look at Each Category: Count the number of symbols next to each category.
- Calculate the Total: Multiply the number of symbols by the value of each symbol (from the key). If there are half-symbols, they represent half the key's value.
For example, if the key says 'One bicycle symbol = 10 bicycles' and a category has 3 bicycle symbols, then that category has 3 x 10 = 30 bicycles.
When to Use a Pictogram:
Pictograms are excellent for showing data in a visually appealing and engaging way. They are great when you want to make data immediately relatable using representative images. However, they can be tricky if values don't neatly fit the symbol's value (e.g., trying to show '7' when each symbol is '5' – you'd need a partial symbol).
Bar Graphs vs. Pictograms: When to Pick Which?
Think of it like choosing the right tool for a job. Both are great for visual comparisons, but they have their strengths:
- Bar Graphs:
- Best for precise comparisons, especially with larger or more varied numbers.
- Easier to read exact values from the Y-axis scale.
- More versatile for different types of numerical data.
- Pictograms:
- Excellent for a quick, eye-catching overview.
- Highly engaging and easy to understand at a glance, especially for simpler data.
- Can be less precise if you need to represent fractional amounts that don't easily translate to partial symbols.
Putting it all Together: Why These Tools Matter in Real Life
Understanding bar graphs and pictograms isn't just for math class; it's a superpower for navigating the real world! You'll see them everywhere: in news reports showing election results, in advertisements comparing product features, in scientific studies illustrating climate change, and even on your phone showing your screen time usage. Being able to quickly read and interpret these visuals means you can make informed decisions, understand complex information faster, and even spot misleading data. You're no longer just looking at numbers; you're understanding the story they tell!
Keep learning, free
Create a free Syllabax account to unlock practice questions and games for this topic.
Visual Learning Enhanced! 🚀
To help you master this topic, we use Advanced Syllabax AI to generate detailed diagrams and visual models.
Note on Visuals: The AI sometimes makes spelling errors in image labels. Please refer to the lesson text for the correct terminology.