Making Predictions from Data
Watch this topic in 60 seconds
Free preview · Lesson 1
Understanding Making Predictions from Data
Making Predictions from Data: Your Detective Guide!
Hey there, young detectives! Have you ever tried to guess what's going to happen next? Maybe you've guessed what snack your mom packed for lunch, or if it's going to rain tomorrow, or even who will win a game. When you do that, you're making a prediction! A prediction is just a super-smart guess about something that might happen in the future.
But how do we make really good, super-smart guesses? We don't just close our eyes and pick a random idea. No, sir! We use something called data. Think of data like clues in a mystery. Just like a detective collects clues to figure out 'whodunit,' we collect data to figure out 'what will happen!'
What is Data, Anyway? (Your Clue Box!)
Data is simply information or facts that we collect. It can be numbers, words, observations, or anything that tells us something about the world. Imagine you're trying to predict if your favorite soccer team will win their next game. What kind of data would you collect?
- How many games they've won so far.
- How many goals they usually score.
- How many goals the other team usually scores.
- If their star player is healthy.
All of those bits of information are data! Data helps us understand what has happened in the past, and that past information is super helpful for guessing what might happen in the future.
Two Main Kinds of Data (Your Different Kinds of Clues):
There are many ways to sort data, but let's look at two simple ones:
- Number Data (Numerical Data): This is data that you can count or measure with numbers. For example, the number of sunny days in a month, the height of your plant, or how many cookies you ate. This kind of data often helps us see trends and changes over time.
- Category Data (Categorical Data): This is data that helps us put things into groups or categories. For example, favorite colors (red, blue, green), types of pets (dog, cat, fish), or yes/no answers. This kind of data helps us see popular choices or common groups.
Finding Patterns: The Key to Super-Smart Guesses!
Collecting data is great, but just having a pile of clues isn't enough. A good detective doesn't just stare at clues; they look for connections and patterns! Patterns are things that repeat or happen in a predictable way. When we find patterns in our data, it's like finding a secret map that tells us where things are headed.
Let's say you're tracking the temperature outside every day for a week. Your data might look like this:
- Monday: 60 degrees
- Tuesday: 62 degrees
- Wednesday: 64 degrees
- Thursday: 66 degrees
Do you see a pattern? The temperature is going up by 2 degrees each day! This is a pattern called a trend. If you saw this pattern, you could make a pretty good guess (a prediction!) that Friday's temperature would be 68 degrees.
Analogy Time! Imagine you're watching a train. You see the first car, then the second, then the third, and they all look the same. You've noticed a pattern! You can predict that the next car will also look similar. Data works the same way – we look for what's been happening to guess what's next.
What Kinds of Patterns Should We Look For?
- Things Going Up or Down: Like the temperature example. Are numbers generally getting bigger or smaller?
- Things Staying the Same: Is something happening again and again without much change?
- Repeated Events: Does something happen every Tuesday? Or every time it rains?
- Most Popular Choice: If most of your friends pick chocolate ice cream, it's a pattern that chocolate is popular.
Making the Prediction (Your Best Guess!)
Once you've collected your data and carefully looked for patterns, it's time to make your prediction! You use the patterns you found to make the most logical guess about what will happen. It's like putting all your puzzle pieces together to see the whole picture.
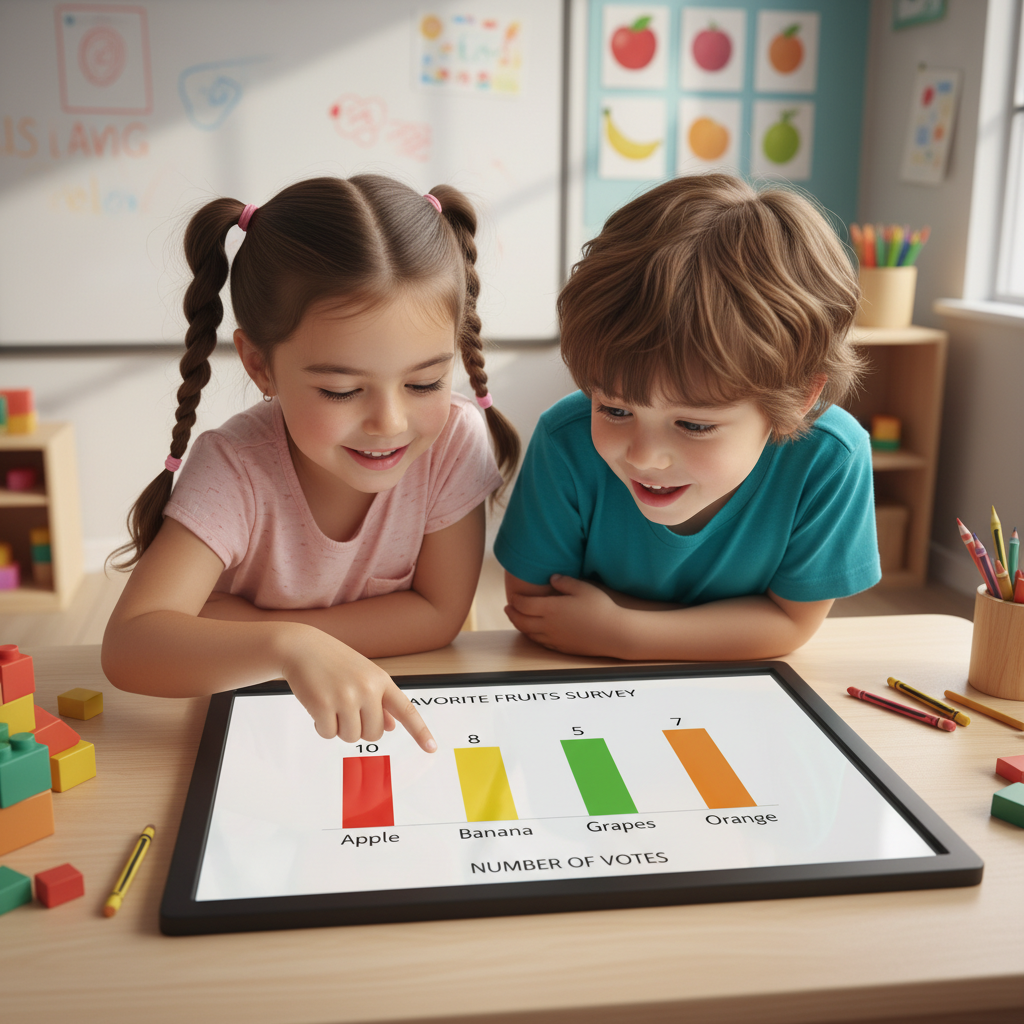
Let's try an example: You want to predict what kind of fruit will be eaten most often at school next week. You decide to collect data this week by watching what kids choose at lunch.
- Monday: 20 apples, 15 bananas, 5 oranges
- Tuesday: 18 apples, 17 bananas, 6 oranges
- Wednesday: 22 apples, 16 bananas, 7 oranges
What patterns do you see? Apples are chosen most often every day! Bananas are second, and oranges are third. Based on this data and the strong pattern, your prediction would be: Apples will likely be the most eaten fruit next week.
Important Note: Predictions Aren't Always Perfect!
Even the best predictions can sometimes be wrong. That's okay! A prediction is a likely outcome, not a guarantee. Think about weather predictions – sometimes they say it will rain, and it doesn't. That's because new things can happen or data might not always show us everything.
But by using data and looking for patterns, our predictions become much, much better than just wild guesses. They help us understand the world around us and even make smart choices.
Steps to Becoming a Prediction Pro!
- Collect Data: Gather your clues! The more good data you have, the better your prediction can be.
- Look for Patterns: Study your data. Are things going up? Down? Repeating? What's the most common?
- Make Your Prediction: Use those patterns to make your best, smartest guess about what comes next.
- Check Your Prediction: See if what you predicted actually happens! This helps you learn and become an even better predictor next time.
So, the next time you want to make a smart guess about something, remember your detective skills: collect data, look for patterns, and make your best prediction!
Keep learning, free
Create a free Syllabax account to unlock practice questions and games for this topic.
Visual Learning Enhanced! 🚀
To help you master this topic, we use Advanced Syllabax AI to generate detailed diagrams and visual models.
Note on Visuals: The AI sometimes makes spelling errors in image labels. Please refer to the lesson text for the correct terminology.