Measures of Central Tendency: Mean
Watch this topic in 60 seconds
Free preview · Lesson 1
Understanding Measures of Central Tendency: Mean
Understanding the Mean: Your Data's Middle Ground
Welcome, Grade 10 learners! Today, we're diving into a super important concept in mathematics: Measures of Central Tendency. Think of these as special tools that help us find the "heart" or "middle ground" of a set of numbers. It's like trying to find the most typical value in a group.
What are Measures of Central Tendency?
Imagine you have a big pile of different-sized rocks. If someone asked you, "What's a typical size rock from this pile?", you wouldn't pick the smallest or the largest, would you? You'd try to find one that represents the 'middle' or 'average' size. Measures of Central Tendency do exactly that for numbers.
There are three main measures: the Mean, the Median, and the Mode. In this lesson, we're going to focus on the most commonly used one: the Mean.
The Mean: The "Fair Share" Average
The mean is what most people typically think of when they hear the word "average." It's like taking all the values in a group and sharing them out equally among all members. Imagine you have a bag of candies, and you want to share them equally among your friends. You'd count all the candies, count all your friends, and then divide the candies by the number of friends. Each friend would get the mean number of candies!
How Do We Calculate the Mean? It's Simple!
Calculating the mean involves just two easy steps:
- Step 1: Add Them All Up! First, you sum (add together) all the numbers in your data set.
- Step 2: Divide by the Count! Next, you divide that sum by how many numbers you originally had in your data set.
Let's look at it with a simple formula:
Mean = (Sum of all values) / (Number of values)
Analogy 1: Sharing Pizzas
Let's say a group of friends ordered pizza. One friend ate 3 slices, another ate 2 slices, and a third ate 7 slices. How many slices did they eat on average?
- Step 1 (Add them up): 3 + 2 + 7 = 12 slices
- Step 2 (Divide by the count): There are 3 friends, so 12 / 3 = 4 slices
Analogy 2: Your Test Scores
Consider your grades. If you got scores of 85, 90, 75, and 100 on four math tests, what's your average score?
- Step 1: 85 + 90 + 75 + 100 = 350
- Step 2: There are 4 test scores, so 350 / 4 = 87.5
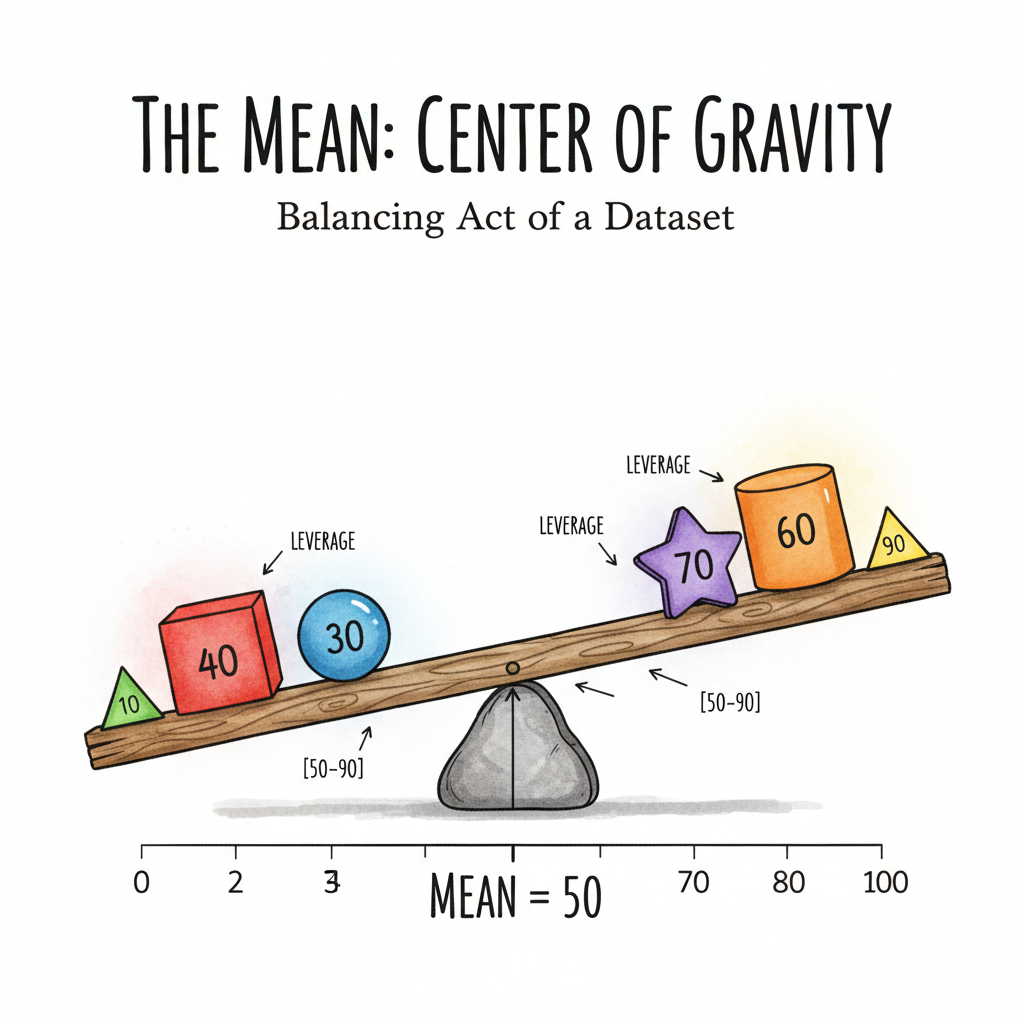
Analogy 3: The Balancing Point
Imagine a seesaw. If you place different weights (your data points) at various spots along the seesaw, the mean is the exact point where you'd need to put the pivot to make the seesaw perfectly balanced. If all values are the same, the mean is that value. If values are spread out, the mean finds that central point of equilibrium.
Why is the Mean so Useful?
- Quick Summary: The mean gives you a single, easy-to-understand number that summarizes a whole set of data.
- Comparison Tool: It's great for comparing different groups. For example, you can compare the average height of students in two different classes.
- Foundation for More Math: The mean is a basic building block for many more advanced statistical concepts you'll learn later.
Real-World Examples of the Mean
- Average Daily Temperature: Meteorologists calculate the mean temperature over a day or a month to describe climate.
- Average Household Income: Economists use the mean to understand the typical earnings of families in a region.
- Average Batting Score: In sports, a baseball player's batting average is a mean (hits divided by at-bats).
A Small Note: When the Mean Might Be Tricky (Foundational)
While the mean is super useful, it's good to know that it can sometimes be heavily influenced by very high or very low numbers, called "outliers." For instance, if most test scores are around 70-80, but one student scores a perfect 100, and another scores a 10, these extreme scores can pull the mean up or down significantly. But for now, just remember that the mean is the "fair share" or "balancing point" average!
Keep practicing, and you'll become a pro at finding the mean of any data set!
Keep learning, free
Create a free Syllabax account to unlock practice questions and games for this topic.
Visual Learning Enhanced! 🚀
To help you master this topic, we use Advanced Syllabax AI to generate detailed diagrams and visual models.
Note on Visuals: The AI sometimes makes spelling errors in image labels. Please refer to the lesson text for the correct terminology.