Our Pet Animals Graph
Watch this topic in 60 seconds
Free preview · Lesson 1
Understanding Our Pet Animals Graph
Our Pet Animals Graph: A Fun Way to Count!
Hello, young learners! Today, we're going on an exciting adventure into the world of pet animals and how we can make their numbers tell us a story. Have you ever wondered which pet is the most popular in your class? Or how many friends have a fluffy cat versus a playful dog? We're going to learn how to find this out using something super cool called a graph!
What are Pet Animals?
First, let's talk about our beloved pet animals! Pet animals are special friends that live with us in our homes. They bring us so much joy, love, and sometimes a lot of funny moments! Think about the soft purr of a cat, the happy wag of a dog's tail, the gentle swim of a fish, or the cheerful chirping of a bird. These are all wonderful pets!
Many people have different kinds of pets. Some homes might have a dog, others a cat, and some might even have a small hamster or a colorful parrot. Wouldn't it be interesting to see which one is the most common among your friends?
What is a Graph? (It's Like a Picture Story!)
Imagine you have a big pile of different colored Lego bricks. You have red, blue, green, and yellow. If you want to know which color you have the most of, you could just count them. But what if you wanted to *show* someone quickly, without saying a single word, which color had the most bricks?
That's where a graph comes in! A graph is like a special kind of picture that helps us see numbers and information very, very clearly. It makes counting fun and easy to understand at a glance. Think of it as a picture storybook for numbers!
Instead of just saying "I have 5 red bricks and 3 blue bricks," a graph can show you tall towers for each color, and you can instantly see which tower is the tallest!
Why Do We Use Graphs?
- To See Information Quickly: Graphs are super helpers! They let us see who has what, or how many of something there is, without reading a long list of numbers. It's like magic!
- To Compare Things Easily: With a graph, you can easily tell if more people like dogs than cats, or if fewer people have fish than birds. It's like standing two friends next to each other to see who is taller – the graph does that for numbers!
- To Share Information: If you make a graph about pet animals, you can show it to your family or friends, and they will understand your findings right away!
Let's Make a Pet Animals Graph!
Imagine we ask everyone in your class, "Which pet animal is your favorite?" We can collect all their answers and put them into a graph. Here's how we do it, step-by-step:
Step 1: Ask and Count! (Our Survey!)
First, we need to ask our friends! Let's say we ask 10 friends about their favorite pet. We'll write down their answers. This is called collecting data.
- Friend 1: Dog
- Friend 2: Cat
- Friend 3: Dog
- Friend 4: Fish
- Friend 5: Dog
- Friend 6: Cat
- Friend 7: Bird
- Friend 8: Dog
- Friend 9: Fish
- Friend 10: Cat
Now, let's count how many friends chose each pet. We can use tally marks! A tally mark is just a little line. Every time someone chooses a pet, we draw a line. When we get to four lines, the fifth line goes across the other four, like a little gate! This helps us count by fives.
Example Tally:
- Dog: |||| (4 friends)
- Cat: ||| (3 friends)
- Fish: || (2 friends)
- Bird: | (1 friend)
Step 2: Draw Your Graph! (Building Our Information Towers!)
Now we have our counts! It's time to draw our graph. We'll make a special kind of graph called a bar graph. Think of bars like tall towers of information.
Every graph needs a few important parts:
- Title: This tells us what the graph is all about. For our graph, a good title would be "Our Class Favorite Pet Animals."
- Labels: These tell us what we are counting. On one side, we'll list the different pet animals (Dog, Cat, Fish, Bird). On the other side, we'll have numbers to show "How Many Friends."
- Bars: These are the colorful towers! The taller the bar, the more people chose that pet. If 4 friends like dogs, the 'dog' bar will go up to the number 4.
Let's imagine our graph now. We draw a line across the bottom for our pets and a line up the side for our numbers.
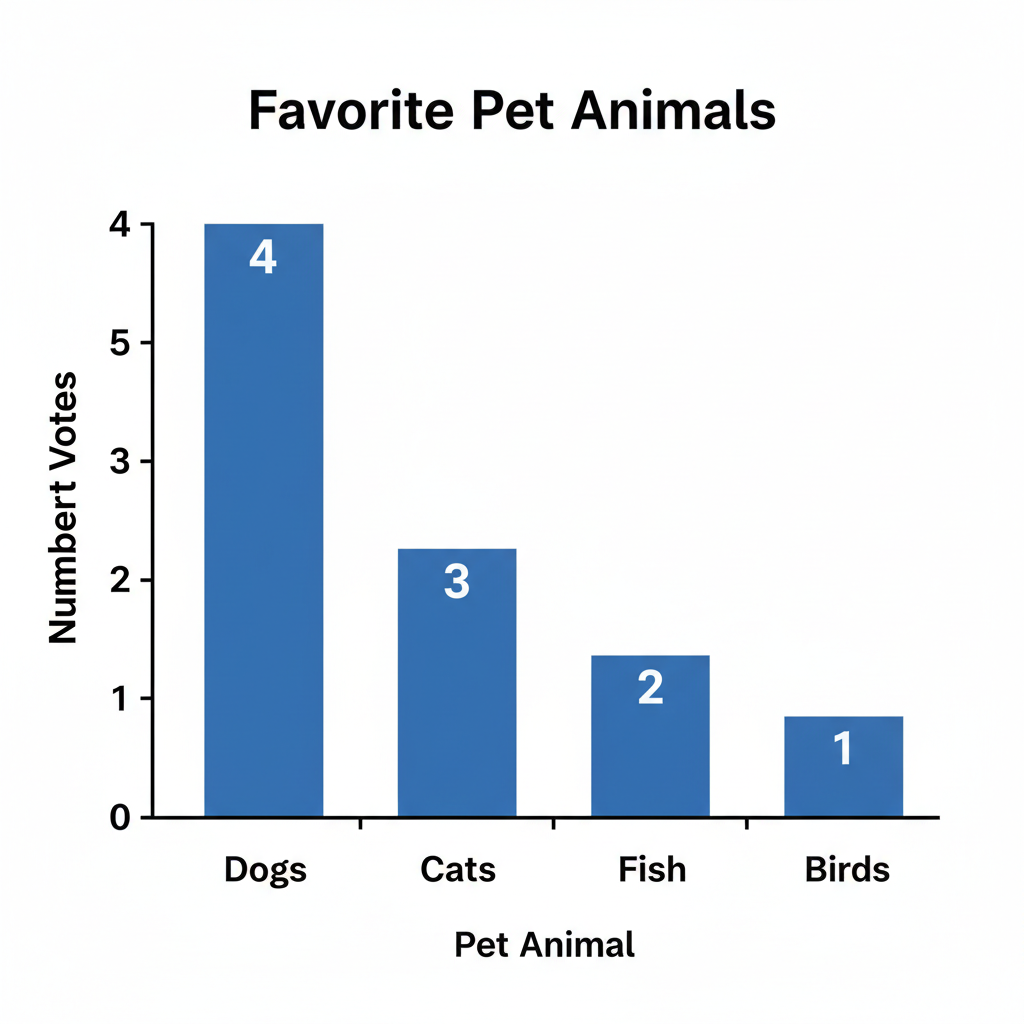
- For dogs, we draw a bar up to the number 4.
- For cats, we draw a bar up to the number 3.
- For fish, we draw a bar up to the number 2.
- For birds, we draw a bar up to the number 1.
 ⚠️ This picture may have spelling mistakes. Trust the words in the lesson.
Reading Our Pet Animals Graph (What Stories Do the Bars Tell?)
Now that our graph is made, let's read the story it tells! Looking at our imaginary graph above:
- Which pet is the most popular? Look for the tallest bar! In our example, the 'Dog' bar goes up to 4, which is the highest. So, dogs are the most popular pet in our class survey!
- Which pet is the least popular? Look for the shortest bar! The 'Bird' bar only goes up to 1. So, birds are the least popular in this survey.
- How many friends like cats? Find the 'Cat' bar and see where its top ends. It ends at the number 3. So, 3 friends like cats!
- How many more friends like dogs than fish? The 'Dog' bar is at 4, and the 'Fish' bar is at 2. If you take away the fish lovers from the dog lovers (4 - 2), you get 2. So, 2 more friends like dogs than fish!
Practice Time!
Graphs help us answer questions like these in a super-fast way. It's like having a special detective tool for numbers! You can make graphs about anything: your favorite colors, favorite fruits, or even how many sunny days there are in a week!
Remember, a graph is a picture that helps us understand numbers better. It has a title, labels, and bars (or other shapes) that show us how much of each thing there is. Keep exploring and making your own picture stories with numbers!
Keep learning, free
Create a free Syllabax account to unlock practice questions and games for this topic.
Visual Learning Enhanced! 🚀
To help you master this topic, we use Advanced Syllabax AI to generate detailed diagrams and visual models.
Note on Visuals: The AI sometimes makes spelling errors in image labels. Please refer to the lesson text for the correct terminology.