Reading Data Tables
Watch this topic in 60 seconds
Free preview · Lesson 1
Understanding Reading Data Tables
Unlocking Secrets: How to Read Data Tables (Grade 6)
Have you ever looked at a list of information and wondered what it all meant? Maybe it was a list of temperatures for the week, scores from a basketball game, or even the different types of snacks in your lunchbox. Often, this information is organized in a super helpful way called a data table. Think of a data table as a very neat and tidy organizer for numbers and words, making it much easier to understand what's going on! In this lesson, we're going to become detectives, learning how to find clues and solve mysteries hidden inside these amazing tables.
What Exactly is a Data Table?
Imagine your school has a list of all the students in your class. Next to each student's name, there's their age, their favorite subject, and whether they like pizza. If all this information was just written in a long paragraph, it would be really hard to find out who the oldest student is or how many students like pizza. That's where a data table comes in!
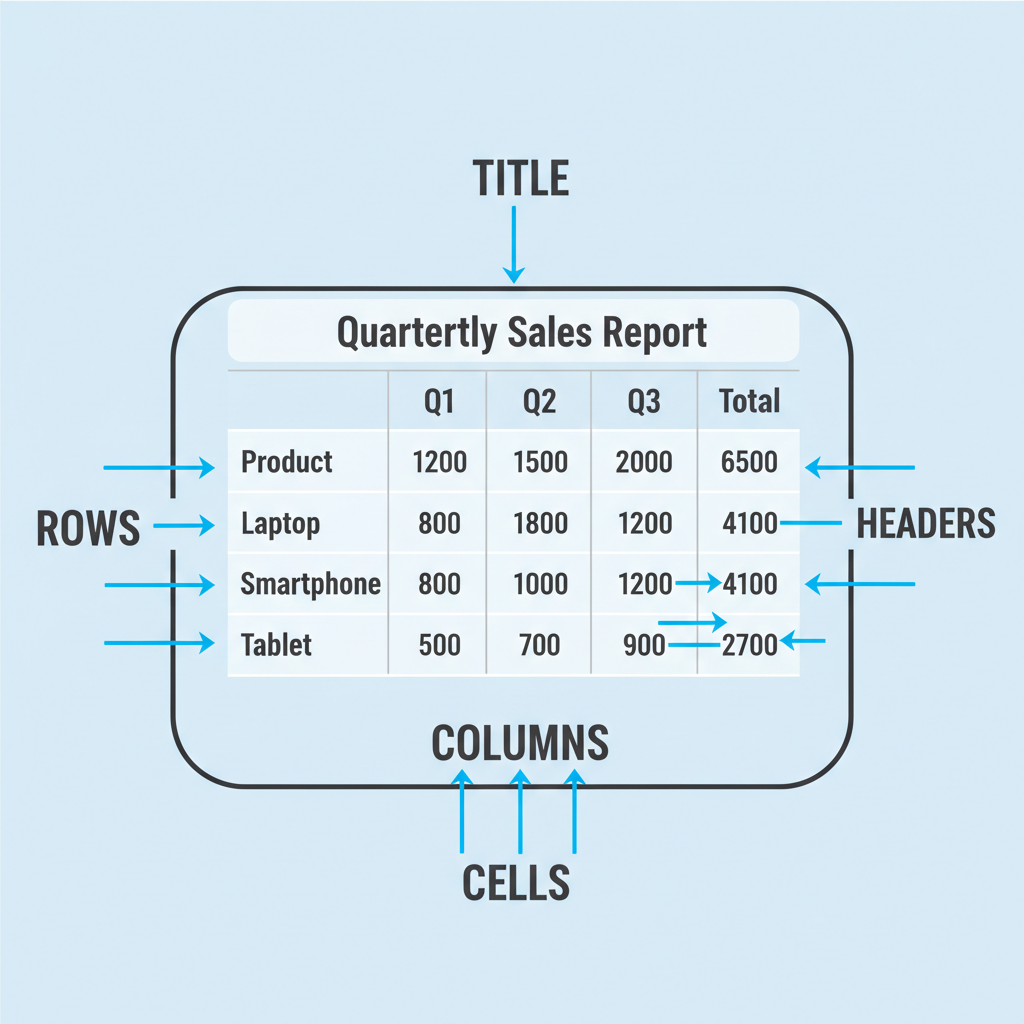
A data table is a visual way to organize information in rows and columns. It's like a grid, making it easy to see connections and compare different pieces of data. Think of it like a neatly arranged bookshelf: all the books (pieces of data) are organized by category (columns) and then by their specific location (rows), so you can find exactly what you're looking for without a huge mess!
The Essential Parts of a Data Table
Every good data table has a few key parts that help us understand it. Let's break them down:
1. The Title: The 'What's This About?' Sign
Just like a book has a title to tell you what it's about, a data table has a title. This is usually at the very top and tells you the main topic or purpose of the table. It's the first thing you should always read! For example, a table might be titled "Favorite Sports of 6th Graders" or "Daily Temperatures in October." The title is your first clue to understanding the whole table.
2. Columns: The Up-and-Down Categories
Imagine vertical lines going down a page. These are columns. Each column usually represents a specific category of information. Think of it like the different types of food groups on a healthy eating plate: you have a column for fruits, a column for vegetables, a column for grains, and so on. All the information in one column belongs to that same category. For instance, in our class list example, one column might be for "Student Name," another for "Age," and another for "Favorite Subject."
At the very top of each column, there's a special label called a column header. This header tells you exactly what kind of information you'll find in that column. It's like the label on a drawer, telling you what's inside.
3. Rows: The Side-to-Side Information Lines
Now, imagine horizontal lines going across the page. These are rows. Each row usually represents a single item, person, or event, with all its related details. If columns are like your food groups, rows are like a complete meal! All the information in a single row describes one specific thing. In our class list, one row would contain all the information about one student: their name, their age, and their favorite subject.
Sometimes, the first item in a row acts like a row header, giving a name to that specific row. For example, if you have a table showing different types of animals, the first column might list the animal names (like "Lion," "Elephant," "Giraffe"), and these would act as row headers.
4. Cells: The Specific Spot
When a row and a column meet, they create a little box. This box is called a cell. A cell holds one specific piece of data. It's like a single cubbyhole in a giant storage unit. If you want to know a specific student's age, you would find that student's row and then look across to the "Age" column. The number in the cell where that row and column cross is the student's age!
How to Be a Data Table Detective: Step-by-Step!
Reading a data table is a skill, and like any skill, it gets easier with practice. Here’s a simple plan to help you find the information you need:
Step 1: Read the Title (The Big Picture)
Always start by reading the title. It tells you what the table is all about. If the title is "Monthly Rainfall in Sunny Valley," you know you're looking for information about rain, not about basketball scores!
Step 2: Look at the Column Headers (What Categories Are There?)
Next, read all the column headers. These tell you what kind of information is listed vertically. For our "Monthly Rainfall" table, you might see column headers like "Month," "Rainfall (inches)," and "Number of Rainy Days." This helps you understand what data is available.
Step 3: Check for Row Headers (What Specific Items Are Listed?)
If there's a column that lists specific items (like names, dates, or places), these are your row headers. In our rainfall example, the "Month" column (January, February, March) would act as a row header, defining each row of data.
Step 4: Find Your Target Cell (The Specific Answer)
Now that you know what the table is about and what kind of information it holds, it's time to find your specific answer! Let's say you want to know the rainfall in March. You would:
- Find the row labeled "March."
- Move your finger or eye across that row until you get to the column labeled "Rainfall (inches)."
- The number in that cell is your answer!
This is like navigating a city grid! You find the street (row) and then the specific building address (column) to reach your destination (the cell).
Step 5: Compare and Interpret (What Does It All Mean?)
Sometimes you need to do more than just find a single piece of information. You might need to compare data. For example, which month had the most rain? To figure this out, you would look down the "Rainfall (inches)" column and find the largest number, then look across to its corresponding "Month" row. This helps you understand the bigger picture that the table is trying to tell you.
Real-Life Examples of Data Tables
- Sports Scores: A table showing teams, their scores for different games, and total points.
- Nutrition Labels: A table on food packaging listing calories, fat, sugar, etc., per serving.
- Bus Schedules: A table showing bus routes, departure times, and arrival times at different stops.
- Weather Forecasts: A table with days of the week, high/low temperatures, and chances of rain.
- Video Game Stats: A table showing characters, their strengths, weaknesses, and special abilities.
You can see data tables everywhere once you know how to spot them! They help us make sense of the world around us, from choosing the best bus to understanding a science experiment's results.
Why is Reading Data Tables Important?
Learning to read data tables is a super important skill for many reasons:
- In School: You'll use them in science to record experiment results, in social studies to compare populations, and in math to organize numbers.
- In Daily Life: You might read a table to compare prices at a store, understand a doctor's report, or plan a trip by looking at travel schedules.
- Problem Solving: Tables help you quickly find specific facts needed to answer questions or solve problems.
- Making Decisions: By easily seeing and comparing information, you can make better choices, like which healthy snack to pick or which movie to watch.
Think of it as learning to read a secret code that unlocks tons of useful information! Once you master this, you'll feel like a real data wizard.
Let's Recap!
You've learned that data tables are powerful tools for organizing information. They have titles, columns (with headers), rows (sometimes with headers), and cells where the data lives. By following a simple step-by-step process, you can easily find specific information, compare different pieces of data, and unlock the secrets hidden within any table. Keep practicing, and you'll be a data table expert in no time!
Keep learning, free
Create a free Syllabax account to unlock practice questions and games for this topic.
Visual Learning Enhanced! 🚀
To help you master this topic, we use Advanced Syllabax AI to generate detailed diagrams and visual models.
Note on Visuals: The AI sometimes makes spelling errors in image labels. Please refer to the lesson text for the correct terminology.