Learning Journey
Free preview · Lesson 1
Understanding Favorite Colors Survey
Let's Find Out: What's Your Favorite Color?! A Fun Survey Adventure!
Hello, super curious learners! Today, we're going on an exciting adventure called a "survey." Have you ever wondered what everyone's favorite color is? Is it bright red, sunny yellow, calm blue, or playful green? A survey helps us find out!
What is a Survey? (It's Like Asking Your Friends!)
Imagine you're having a party, and you want to know what kind of snacks your friends like best. Do they want pretzels, fruit, or cookies? You wouldn't just guess, right? You'd ask them! "Hey Maya, what's your favorite snack?" "Hi Leo, what snack do you want?"
Asking questions to lots of people to learn something is exactly what a survey is! It's like being a detective, but instead of finding clues about a mystery, you're finding clues about what people like or think.
We do surveys all the time without even realizing it! When your teacher asks "Who wants to read next?", that's a mini-survey! When your family decides what movie to watch, they might ask everyone's favorite, and that's a survey too!
Why Do We Do Surveys? (To Learn Cool Stuff!)
Surveys help us learn about groups of people. If we know what most kids in our class like, we can make better choices. For example:
- If we survey and find out everyone loves pizza, we know what to order for lunch!
- If we survey and find out most people like to play tag, we know what game to play at recess!
Today, our big question is: "What is your favorite color?" We want to know which color is the most popular!
Let's Get Started: Your Favorite Colors Survey!
Step 1: Pick Your Question!
For our survey, our question is already picked for us: "What is your favorite color?" It's a simple, clear question that everyone can answer easily.
Think about the colors you know: red, orange, yellow, green, blue, purple, pink, brown, black, white, gray! So many choices!
Step 2: Ask Your Friends and Family!
Now for the fun part! Go to your friends, family, or even your stuffed animals (you can guess for them!). Ask each person, "What is your favorite color?"
Remember to be polite! Say "Please" and "Thank you" when you ask for their answer. Listen carefully to what they say.
Step 3: Record the Answers with Tally Marks! (Like Keeping Score!)
When someone tells you their favorite color, you need a way to remember it. This is called collecting data. Data is just a fancy word for all the answers you get.
We're going to use something super simple and cool called tally marks. Tally marks are like little lines that help us count.
- For the first person who says "Blue," you draw one line: |
- For the second person who says "Blue," you draw another line: ||
- For the third person: |||
- For the fourth person: ||||
Now, here's the trick for the fifth person! Instead of drawing a fifth line next to the others, you draw a line *across* the first four lines. It looks like this: |||| This makes it super easy to count groups of five, just like a bundle of 5 sticks!
Let's make a chart like this to keep track:
| Favorite Color | Tally Marks |
|---|---|
| Red | |
| Blue | |
| Green | |
| Yellow | |
| Pink | |
| Other |
As you ask each person, put a tally mark next to their favorite color. If someone says a color not on your list (like "Purple" or "Orange"), you can add it, or put it under "Other."
Step 4: Count Your Tallies! (Finding Out Who "Won"!)
Once you've asked everyone you wanted to, it's time to count up all your tally marks. Remember, each group of |||| is 5! So, if you see |||| ||, that's 5 + 2 = 7!
Write down the total number for each color.
| Favorite Color | Number of Friends Who Like It |
|---|---|
| Red | (Count your tallies here!) |
| Blue | (Count your tallies here!) |
| Green | (Count your tallies here!) |
| Yellow | (Count your tallies here!) |
| Pink | (Count your tallies here!) |
| Other | (Count your tallies here!) |
Step 5: Show Your Results with a Graph! (Like Building Towers!)
Now you have all the numbers, but sometimes it's even easier to understand if we can *see* the results. We can do this with a graph!
A graph is like building towers with blocks to show how many people chose each color. The taller the tower, the more popular that color is!
Imagine a graph where each square means one person. If 5 people like Red, you'd color in 5 squares above "Red." If 3 people like Blue, you color in 3 squares above "Blue."
This kind of graph is called a bar graph. Each color gets its own "bar" or tower.
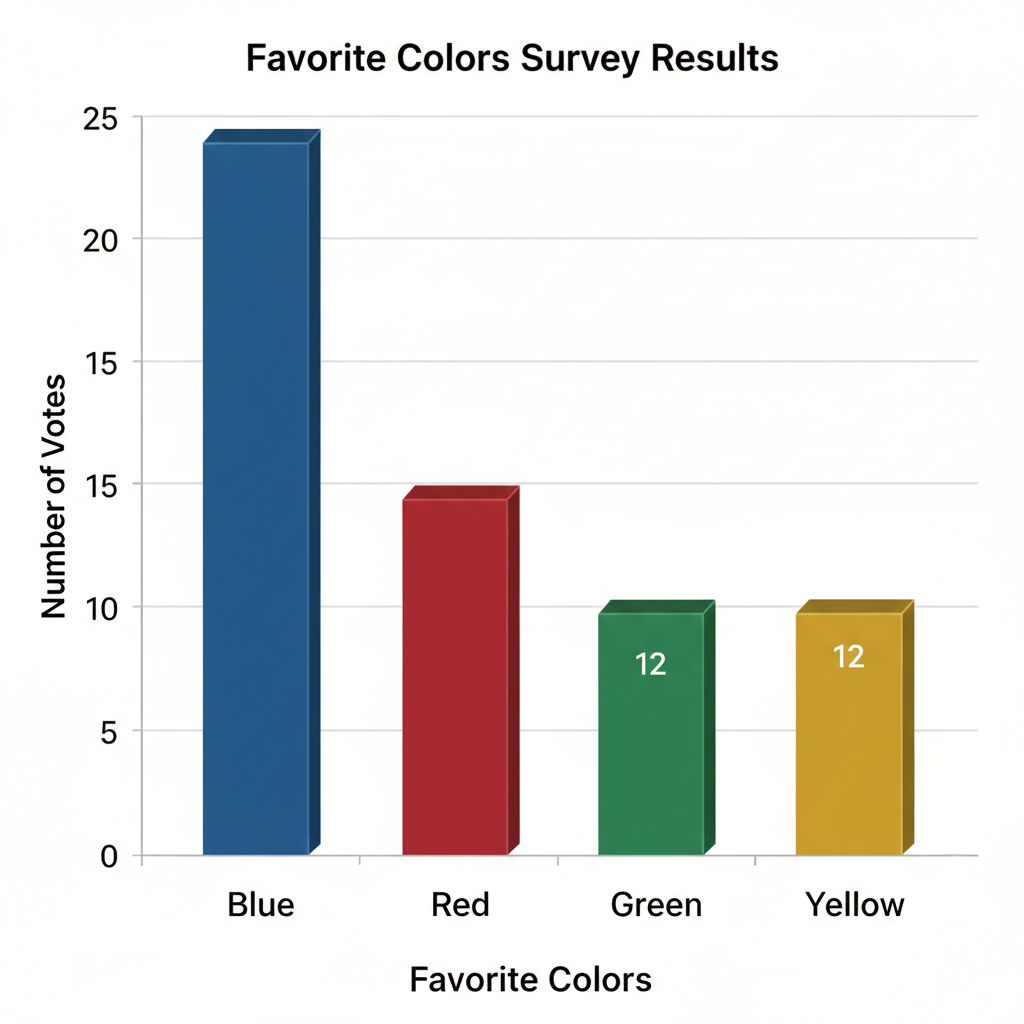
Looking at your graph, you can quickly see which color has the tallest tower. That's your class's or family's most favorite color!
What Did We Learn?
You just completed your very own survey! You:
- Asked a question.
- Collected data (answers).
- Used tally marks to keep track.
- Counted the results.
- Learned how to show results on a graph.
Isn't that amazing? You're now a data detective, finding out what people think and like. This skill helps us understand the world around us better, and it's super useful in many places, even for grown-ups!
Keep practicing your survey skills. You can survey your friends about favorite animals, favorite books, or even favorite ice cream flavors!
Keep learning, free
Create a free Syllabax account to unlock practice questions and games for this topic.
Visual Learning Enhanced! 🚀
To help you master this topic, we use Advanced Syllabax AI to generate detailed diagrams and visual models.
Note on Visuals: The AI sometimes makes spelling errors in image labels. Please refer to the lesson text for the correct terminology.