Reading Simple Bar Graphs
Watch this topic in 60 seconds
Free preview · Lesson 1
Understanding Reading Simple Bar Graphs
Reading Simple Bar Graphs: A Fun Adventure!
Hello, young learners! Get ready for an exciting adventure into the world of numbers and pictures! Today, we're going to learn about something super cool called a Bar Graph. Think of a bar graph as a special kind of picture that helps us count and compare things easily. It's like magic for numbers!
What is a Bar Graph?
Imagine you have a big box of your favorite toy blocks. Some are red, some are blue, some are yellow, and some are green. If you wanted to show your friend how many blocks you have of each color, how would you do it? You could line them up, but a bar graph is even better!
A bar graph uses colorful "bars" (like tall buildings or towers) to show "how much" or "how many" of different things there are. The taller or longer a bar is, the more of that item you have!
Analogy 1: Building Block Towers
Think about building towers with your blocks. If you make a tall tower with all your red blocks and a shorter tower with your blue blocks, you can instantly see that you have more red blocks, right? A bar graph does the same thing, but instead of physical blocks, it uses lines and colors on paper to show information. Each "bar" is like a different block tower showing the count for something.
The Important Parts of a Bar Graph
Just like a good storybook has a title and different chapters, a bar graph has different parts that help us understand it. Let's explore them:
-
The Title: What's the Story About?
Every bar graph has a Title. This is like the name of a book or movie. It tells you what the graph is all about. For example, a title might be "Our Favorite Fruits" or "Number of Pets in Our Class." It gives us the main idea!
-
Labels: What Are We Counting?
Underneath or next to each bar, you'll find a Label. These labels tell us what we are counting. If our graph is about favorite fruits, the labels might be "Apples," "Bananas," "Oranges," and "Grapes." Each label has its own special bar.
-
The Bars: The Colorful Towers of Information!
These are the most exciting parts! The Bars are the colorful rectangles that go up or across. They show the actual amounts. Remember our block towers? A tall bar means there's a lot of that item, and a short bar means there's less.
-
Numbers (or Scale): How Many?
Along one side (usually the left side for bars going up, or the bottom for bars going across), you'll see Numbers. This is like a ruler! It helps you measure how high or how long each bar goes. If a bar reaches the number '5', it means there are 5 of that item. If it reaches '10', there are 10!
Let's look at an example!
How to Read a Bar Graph: Step-by-Step!
Reading a bar graph is like being a detective! You look for clues to understand the information. Here's how to do it:
-
Step 1: Read the Title!
First, always look at the title. What is this graph telling us about? Is it about favorite foods? The number of sunny days? The title is your first clue!
-
Step 2: Look at the Labels!
Next, check the labels under or next to the bars. These tell you what specific things are being counted. Like in our example above, the labels might be "Red," "Blue," "Green," "Yellow," "Purple" for favorite colors.
-
Step 3: Find the Bars and Numbers!
Now, pick one bar. Follow it with your finger to see how high it goes. Then, slide your finger across to the numbers on the side (the scale). The number it points to tells you how many of that item there are.
Analogy 2: A Height Chart for Information
Have you ever stood against a wall to see how tall you are? You look at your head and then find the number on the measuring tape that matches your height. A bar graph works the same way! Each bar is like a person standing tall, and the numbers on the side are like the measuring tape telling you their "number height."
What Can Bar Graphs Help Us Find Out?
Bar graphs are amazing because they help us answer questions super fast!
- Most Popular: Which bar is the tallest? That shows you what item has the most!
- Least Popular: Which bar is the shortest? That shows you what item has the least!
- How Many: You can quickly see exactly how many of each item there are.
- Compare: You can see if there are more of one thing than another just by looking at the bars' heights.
Let's try another example with a different graph!
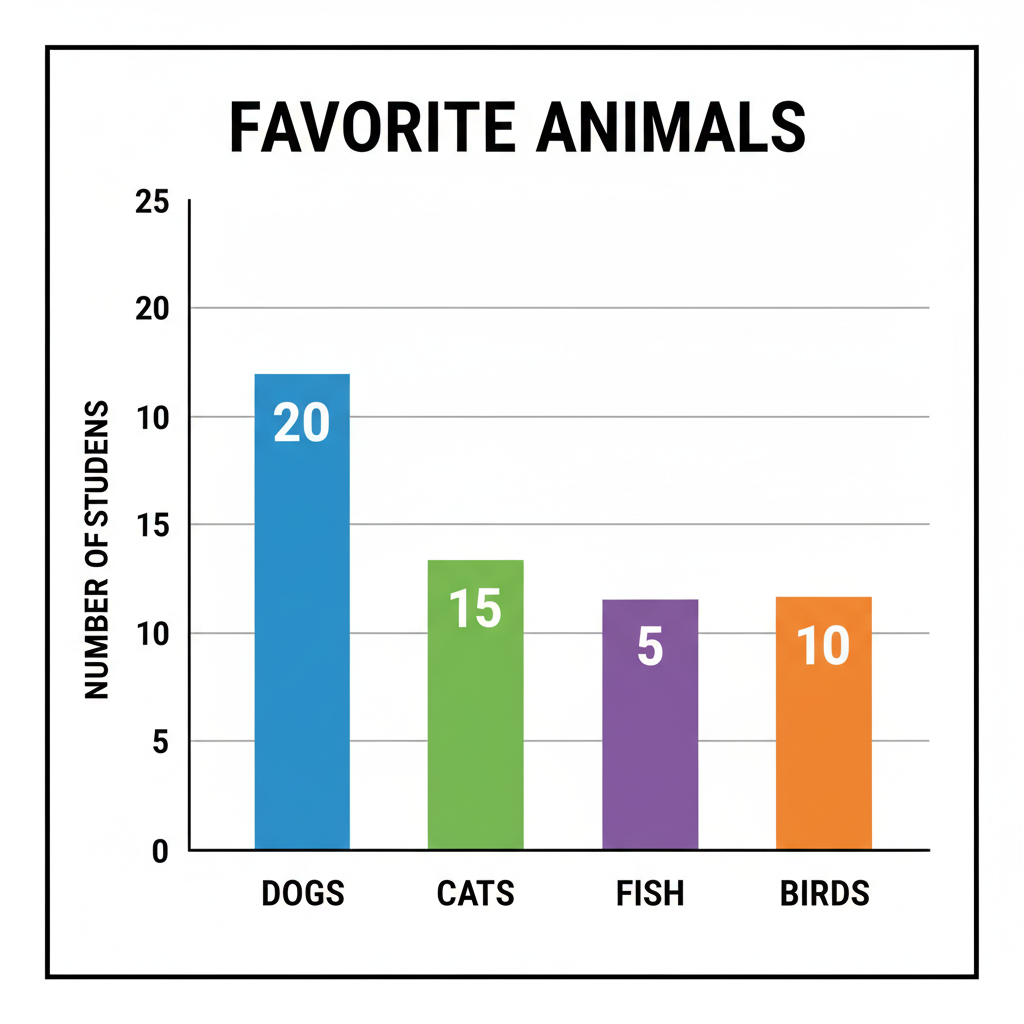
If this graph shows "Our Favorite Animals" and the bar for "Dogs" goes up to 8, it means 8 people like dogs the most! If the bar for "Fish" only goes up to 2, then only 2 people like fish the most. Easy peasy!
Time for a Quick Review!
Remember, a bar graph is a clever picture that uses bars to show numbers. It has a title, labels, colorful bars, and numbers to help you count. It's like a special map that helps you find information about "how many" or "how much"!
Keep practicing, and you'll become a bar graph expert in no time!
Keep learning, free
Create a free Syllabax account to unlock practice questions and games for this topic.
Visual Learning Enhanced! 🚀
To help you master this topic, we use Advanced Syllabax AI to generate detailed diagrams and visual models.
Note on Visuals: The AI sometimes makes spelling errors in image labels. Please refer to the lesson text for the correct terminology.