Bar Graphs: Introduction
Watch this topic in 60 seconds
Free preview · Lesson 1
Understanding Bar Graphs: Introduction
Introduction to Bar Graphs: Your Data Superpowers!
Hey there, young data explorers! Have you ever seen a picture that tells you a whole story without using many words? That's what a bar graph does! Think of it like a special kind of drawing that helps us compare different things very, very easily. It's like having a superpower to understand information at a glance!
What is a Bar Graph, Anyway?
Imagine you have a bunch of building blocks, and you want to show how many red blocks you have compared to blue blocks, or green blocks. You could stack all the red blocks into one tall tower, all the blue blocks into another tower, and all the green blocks into a third tower. When you look at these towers, it's super easy to see which color has the most blocks (the tallest tower!) and which has the fewest (the shortest tower!).
A bar graph is exactly like that! Instead of real building blocks, we use colorful rectangles (called bars) to show amounts of different things. Each bar's height (or length, if it's lying down) tells you 'how much' or 'how many' there are of something. It's a fantastic way to organize and display information so we can compare it quickly and understand it better.
Why Do We Use Bar Graphs? (The Superpower Reason!)
- Quick Comparisons: It's like having a race for data! You can instantly see who's winning (the tallest bar) and who's coming in last (the shortest bar). Much faster than reading long lists of numbers!
- Clear Storytelling: Bar graphs tell a clear story with pictures. Imagine trying to explain how many students like apples, bananas, and oranges by just saying numbers. A bar graph shows you the full picture in one go.
- Easy to Understand: Even grown-ups use bar graphs all the time for work, news, and planning because they make complicated information simple to grasp.
The Essential Parts of a Bar Graph (Your Graph's 'Body Parts')
Just like you have a head, arms, and legs, a bar graph has several important parts that help it do its job. Let's learn about them!
1. The Title: What's the Story About?
Every good book has a title, right? A bar graph needs one too! The title tells you exactly what the graph is all about. It's usually at the very top. For example, 'Favorite Colors of 5th Graders' or 'Number of Pets in Our Class'.
2. The Axes: The Floor and the Wall!
Imagine you're building those block towers. You need a floor to build on, and sometimes a wall to lean them against. In a bar graph, we have two main lines called axes:
- Horizontal Axis (The 'Floor'): This line goes straight across, like the horizon where the sky meets the land. It usually has the labels for the different categories we are comparing (e.g., 'Red', 'Blue', 'Green' or 'Apples', 'Bananas').
- Vertical Axis (The 'Wall'): This line goes straight up and down. It usually has the numbers (or the 'scale') that tell us 'how many' or 'how much' each bar represents.
3. Labels (Categories): What Are We Comparing?
These are the names of the things we are counting or comparing. They are usually found along the horizontal axis. If you're comparing favorite fruits, the labels might be 'Apple', 'Banana', 'Orange'. Each label gets its own bar.
4. The Scale (Numbers): How High Should the Bar Go?
The scale is the set of numbers along the vertical axis (the 'wall'). It's like a ruler that helps you measure the height of each bar. The numbers usually start at zero and go up in even steps (like 0, 1, 2, 3 or 0, 5, 10, 15). This helps us know exactly how much each bar represents.
5. The Bars: The Towers of Information!
These are the colorful rectangles! Each bar stands above its label (or next to it, if the bars are horizontal). The height of each bar shows you the amount or quantity for that specific label. The taller the bar, the greater the amount!
How to Read a Bar Graph (Your Decoding Skills!)
Reading a bar graph is like reading a map – once you know the parts, it's super easy to find your way!
- Look at the Title First: This tells you the main idea. What is this graph trying to show you?
- Check the Labels: Look at the names under (or next to) each bar. What different items or groups are being compared?
- Understand the Scale: Look at the numbers on the side. What do these numbers mean? (Is it 'number of students', 'number of points', 'number of hours'?) How do the numbers count up (by ones, by twos, by fives)?
- Find the Bar You Want: Locate the bar for the specific item you're interested in.
- Read the Height/Length: Move your finger straight across from the top of the bar to the numbers on the scale. That number is the value for that bar!
- Compare and Conclude: Now you can compare bars! Which is tallest? Which is shortest? Which two are the same height?
Let's Practice with an Example: Favorite Ice Cream Flavors!
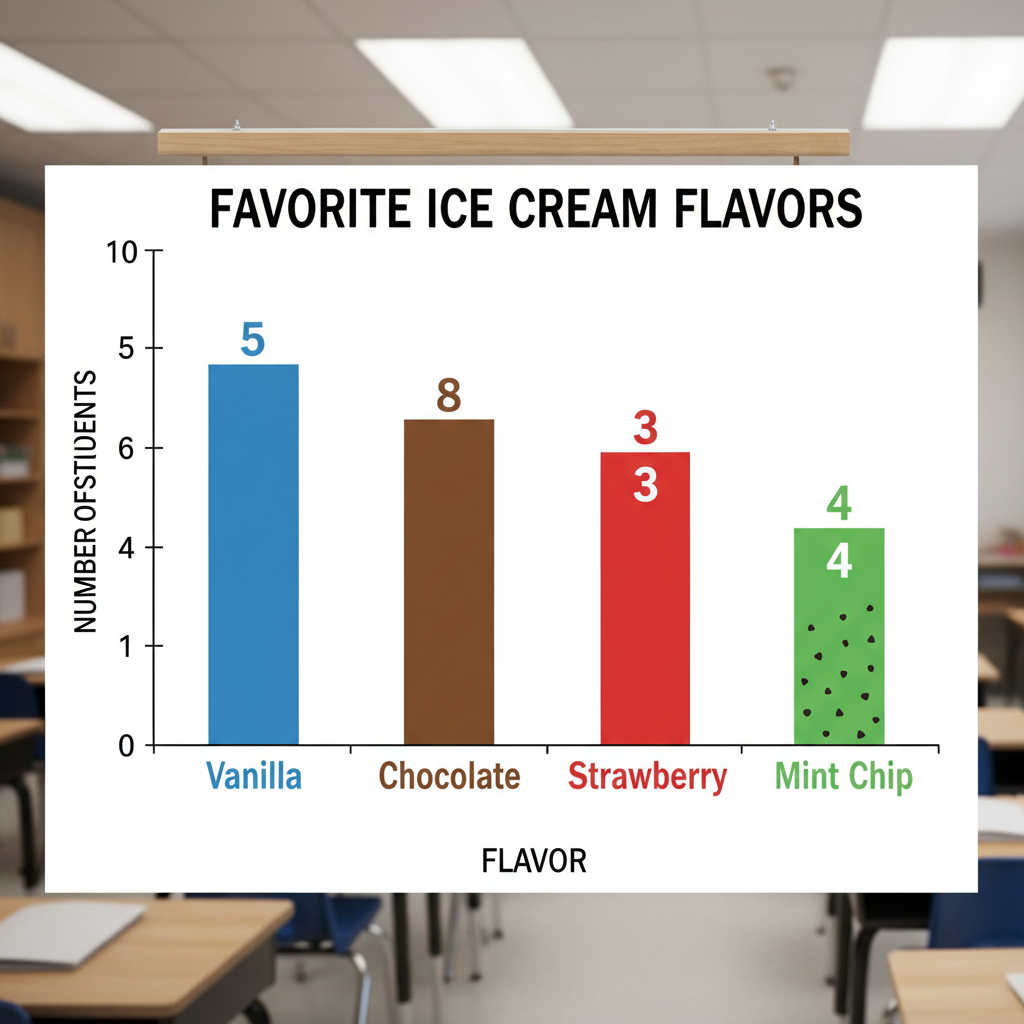
Imagine a bar graph titled 'Favorite Ice Cream Flavors in Ms. Lily's Class'.
- The horizontal axis has labels: 'Vanilla', 'Chocolate', 'Strawberry', 'Mint Chip'.
- The vertical axis has numbers from 0 to 10, counting by 1s (0, 1, 2, 3...). This is the 'Number of Students'.
- We see a bar for Vanilla goes up to 5.
- A bar for Chocolate goes up to 8.
- A bar for Strawberry goes up to 3.
- A bar for Mint Chip goes up to 4.
What can we learn?
- Chocolate is the most popular flavor (tallest bar, 8 students).
- Strawberry is the least popular (shortest bar, 3 students).
- More students like Vanilla than Mint Chip (5 vs. 4).
See how easy it is to get all that information just by looking at the picture?
 ⚠️ This picture may have spelling mistakes. Trust the words in the lesson.
Your New Data Superpower!
Bar graphs are everywhere! You'll see them in books, on TV, on the internet, and even in games. Now that you know how to read them, you have a new superpower to understand information better and faster. Keep practicing, and you'll be a data detective in no time!
Keep learning, free
Create a free Syllabax account to unlock practice questions and games for this topic.
Visual Learning Enhanced! 🚀
To help you master this topic, we use Advanced Syllabax AI to generate detailed diagrams and visual models.
Note on Visuals: The AI sometimes makes spelling errors in image labels. Please refer to the lesson text for the correct terminology.