Creating Our Own Data Project
Watch this topic in 60 seconds
Free preview · Lesson 1
Understanding Creating Our Own Data Project
Let's Be Data Detectives! Creating Our Own Data Project
Hello, young explorers! Today, we're going on an exciting adventure where we get to be super smart detectives, but instead of looking for lost kittens, we're looking for information! This adventure is called 'Creating Our Own Data Project'. Sounds fancy, right? Don't worry, it's just a fun way to learn new things about our world.
What is 'Data'? It's Like Building Blocks!
First, let's talk about data. Data is simply information, facts, or numbers that we collect. Think of data like LEGO bricks or building blocks. Each block is a tiny piece of information. When you put them all together, you can build something amazing and learn a lot!
- If you count how many students in your class like apples, that's data! (Maybe 15 students like apples.)
- If you notice the color of cars passing by your school, that's data! (Many cars are white, fewer are red.)
- If you write down how many sunny days we have in a week, that's data! (Maybe 3 sunny days.)
Data helps us understand things better. It's like having all the pieces of a puzzle!
What is a 'Data Project'? It's a Treasure Hunt for Answers!
Now, what about a data project? A data project is like going on a special treasure hunt. Instead of looking for gold, we're looking for answers to questions we have. We collect our 'data' (our building blocks or clues), put them together, and then see what story they tell us. It's a journey to discover new things!
Every data project has a few important steps, just like baking a cake has steps. If you skip a step, the cake might not turn out right! So, let's learn the steps:
Step 1: Ask a Question (Be Curious!)
The very first step in any data project is to ask a question. This is like deciding what kind of treasure you want to find! What are you curious about? What do you want to learn?
- Maybe you want to know: "What is the favorite color of students in our class?"
- Or: "How many different types of trees are there in the schoolyard?"
- Or even: "What kind of pets do my friends have?"
Asking a good question helps us know exactly what data to look for.
Step 2: Collect Data (Gather Your Clues!)
Once you have your question, it's time to collect data! This means going out and finding the answers to your question. It's like gathering clues in your treasure hunt!
- If you want to know favorite colors, you might ask each classmate and write down their answer. This is called a survey.
- If you want to know types of trees, you might walk around the schoolyard and count each different tree you see. This is called observation.
- You could also count things, like how many times a red ball bounces in a minute.
It's important to collect your data carefully and accurately, just like a detective makes sure to get all the right clues!
Step 3: Organize Data (Sort Your Treasure!)
After you've collected all your data, you'll have a big pile of information, like a big pile of unsorted toys. The next step is to organize data. This means putting your information in order so it's easier to see and understand. It's like sorting your LEGO bricks by color or size!
- You could use tally marks. If 5 people like blue, you draw |||| |.
- You could make a simple list or a chart with pictures. For example, draw a column for 'apples' and put a picture of an apple for each person who likes them.
- You might even make a bar graph, where taller bars mean more of something.
Organizing data helps you see patterns and makes it much easier to find the answer to your question.
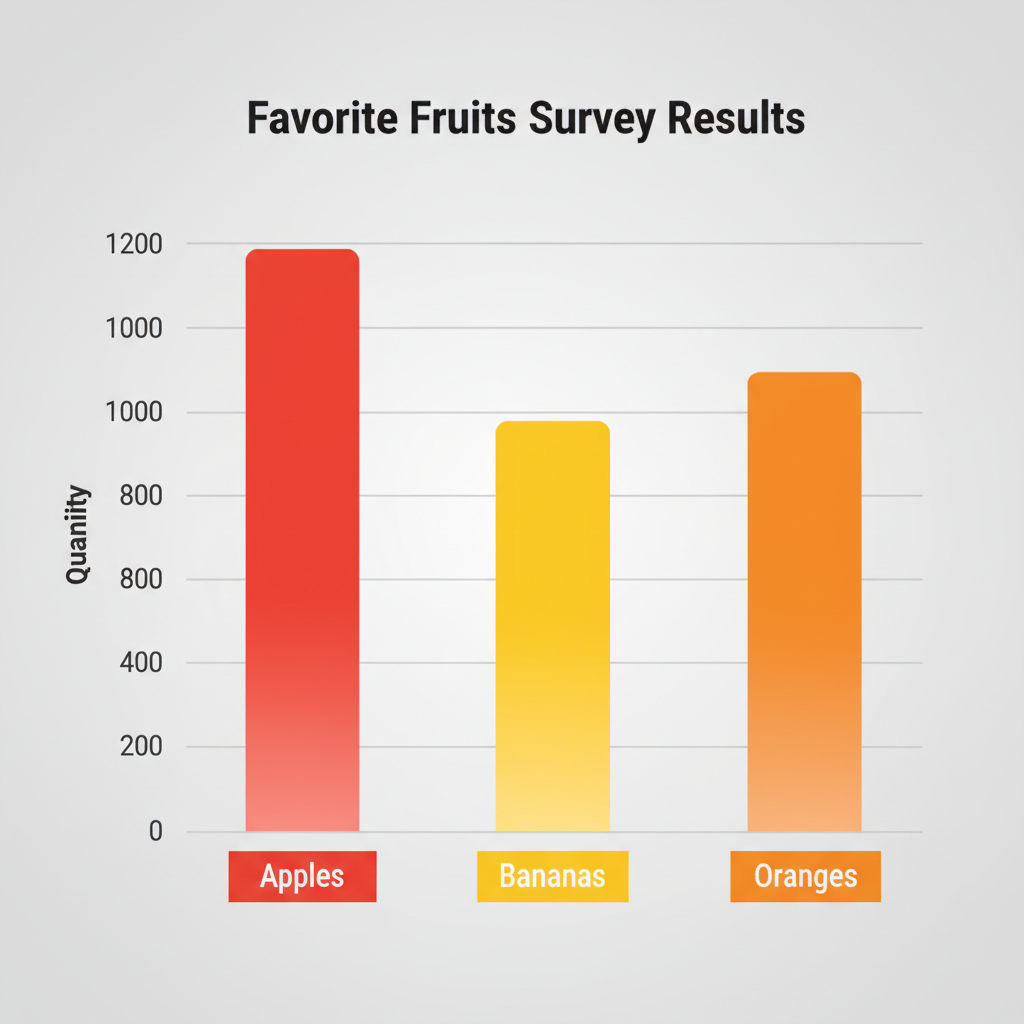 ⚠️ This picture may have spelling mistakes. Trust the words in the lesson.
Step 4: Analyze and Understand Data (What Story Does It Tell?)
Once your data is organized, it's time for the really exciting part: analyze and understand data! This means looking at your organized information and figuring out what it tells you. It's like reading the map you made from your treasure hunt clues to find the 'X' marks the spot!
- If your chart shows a very tall bar for 'blue' as a favorite color, it means many people in your class like blue!
- If you counted trees and saw mostly oak trees, you know oak trees are common in your schoolyard.
- You're looking for the biggest numbers, the smallest numbers, and anything that stands out.
This step is where you find the answer to the question you asked in Step 1!
Step 5: Share Your Findings (Tell Everyone About Your Treasure!)
Finally, after all your hard work, it's time to share your findings! This means telling others what you learned from your data project. It's like showing everyone the treasure you found!
- You could show your class the chart or graph you made.
- You could tell your family about the favorite colors in your class.
- You could even draw pictures of what you discovered.
Sharing helps other people learn too, and it's a great way to celebrate your success as a data detective!
Why Are Data Projects Important?
Data projects help us learn about the world around us. They help us make smart decisions, understand our community, and even solve little mysteries. From figuring out what snack most students like to knowing which books are most popular in the library, data projects help us get answers and learn new things every day!
So, get ready to ask questions, gather clues, sort your findings, and discover amazing things. You are now ready to be a data detective!
Keep learning, free
Create a free Syllabax account to unlock practice questions and games for this topic.
Visual Learning Enhanced! 🚀
To help you master this topic, we use Advanced Syllabax AI to generate detailed diagrams and visual models.
Note on Visuals: The AI sometimes makes spelling errors in image labels. Please refer to the lesson text for the correct terminology.