Learning Journey
Watch this topic in 60 seconds
Free preview · Lesson 1
Reading Charts (bar, line, pie – basic) -Data Interpretation (Foundation Level) (Foundational)
Reading Charts (Bar, Line, Pie) - Data Interpretation (Foundation Level)
Hi there, future data detectives! Today, we're going to learn how to read charts. Charts are like pictures that show us information in a quick and easy way. We'll look at three types of charts: bar charts, line charts, and pie charts.
What is Data?
First, let's understand what data is. Data is just information, like how many students like pizza, what the temperature is each day, or how many cars are different colors.
Types of Charts
1. Bar Charts
Bar charts use bars to show data. The taller the bar, the more there is of something. Look at this example:
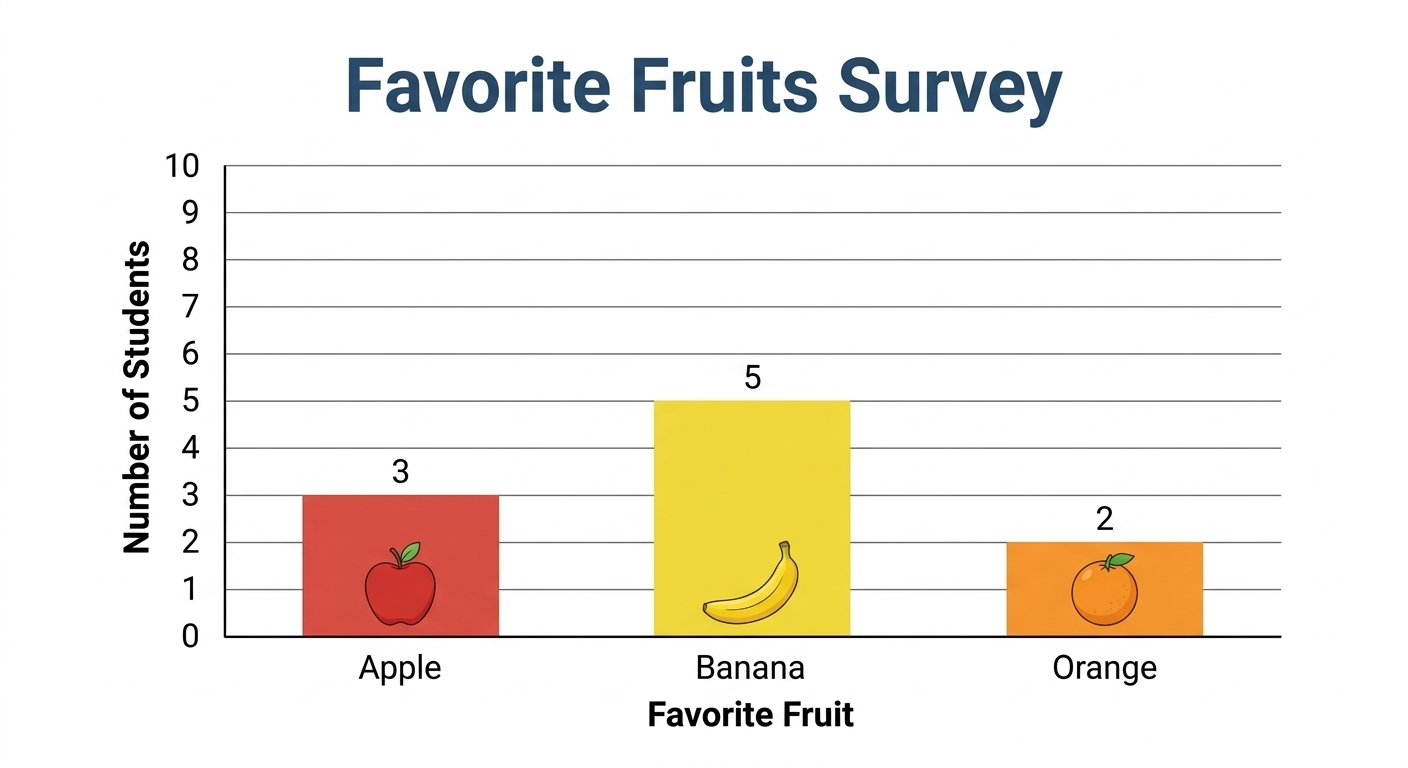 X-axis (horizontal): This line usually shows what we are counting (like fruits, colors, or days).
- Y-axis (vertical): This line usually shows how many of each thing there are (the count).
To read a bar chart, find the bar you're interested in, and then look to the left to see what number the top of the bar lines up with on the Y-axis. That's how many!
2. Line Charts
Line charts use a line to show how data changes over time. Think about tracking the temperature each day.
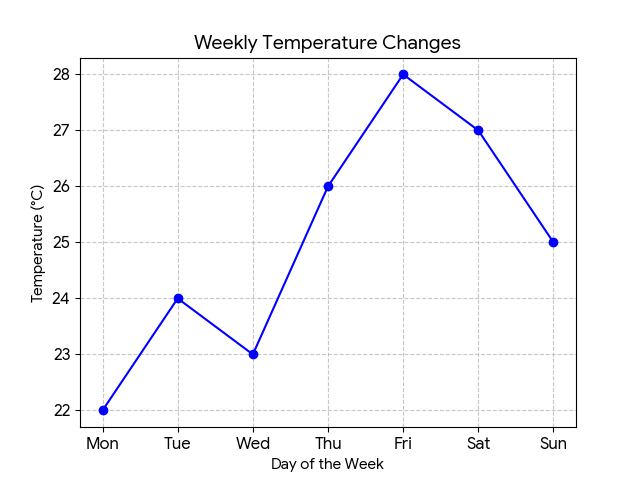 ⚠️ This picture may have spelling mistakes. Trust the words in the lesson.X-axis (horizontal): Usually shows time (days, months, years).
- Y-axis (vertical): Shows the quantity we're measuring (like temperature, sales, or height).
To read a line chart, find the point on the line for the time you're interested in. Then, look to the left to see what number that point lines up with on the Y-axis.
3. Pie Charts
Pie charts (also called circle charts) show how a whole thing is divided into parts. Think of it like slicing a pizza!
The entire circle (pie) represents 100%.
- Each slice of the pie represents a different category.
- The size of the slice tells you what percentage of the whole that category represents. A bigger slice means a larger percentage.
Data Interpretation
Data interpretation simply means understanding what the chart is telling you. It's like reading a story from a picture. Ask yourself questions like:
- What is the chart about?
- What is the biggest/smallest value?
- What does this information mean?
Keep learning, free
Create a free Syllabax account to unlock practice questions and games for this topic.
Visual Learning Enhanced! 🚀
To help you master this topic, we use Advanced Syllabax AI to generate detailed diagrams and visual models.
Note on Visuals: The AI sometimes makes spelling errors in image labels. Please refer to the lesson text for the correct terminology.