Choosing the Best Measure of Center
Watch this topic in 60 seconds
Free preview · Lesson 1
Understanding Choosing the Best Measure of Center
Choosing the Best Measure of Center: Finding the Heart of Your Data
Welcome, 9th graders! Today, we're going on an exciting detective mission: to find the 'heart' or 'center' of a set of numbers. Imagine you have a bunch of information, like test scores, heights of students, or how many video games your friends own. Sometimes, looking at all the individual numbers can be overwhelming. We need a way to summarize them with just one special number that tells us what's typical or central.
In statistics, we have three main 'detectives' for finding the center: the Mean, the Median, and the Mode. Each one has its own strengths and weaknesses, like different tools in a toolbox. Our job is to learn when to use which tool for the best results!
1. The Mean: The "Fair Share" Average
The Mean is probably the one you know best – it's just the average! Think of it like this: if you gathered all the candy everyone in your class had and then redistributed it so everyone had an equal amount, that equal amount would be the mean. It's about 'fair share' or 'balancing things out'.
- How to Calculate It: Add up all the numbers in your data set, and then divide by how many numbers there are.
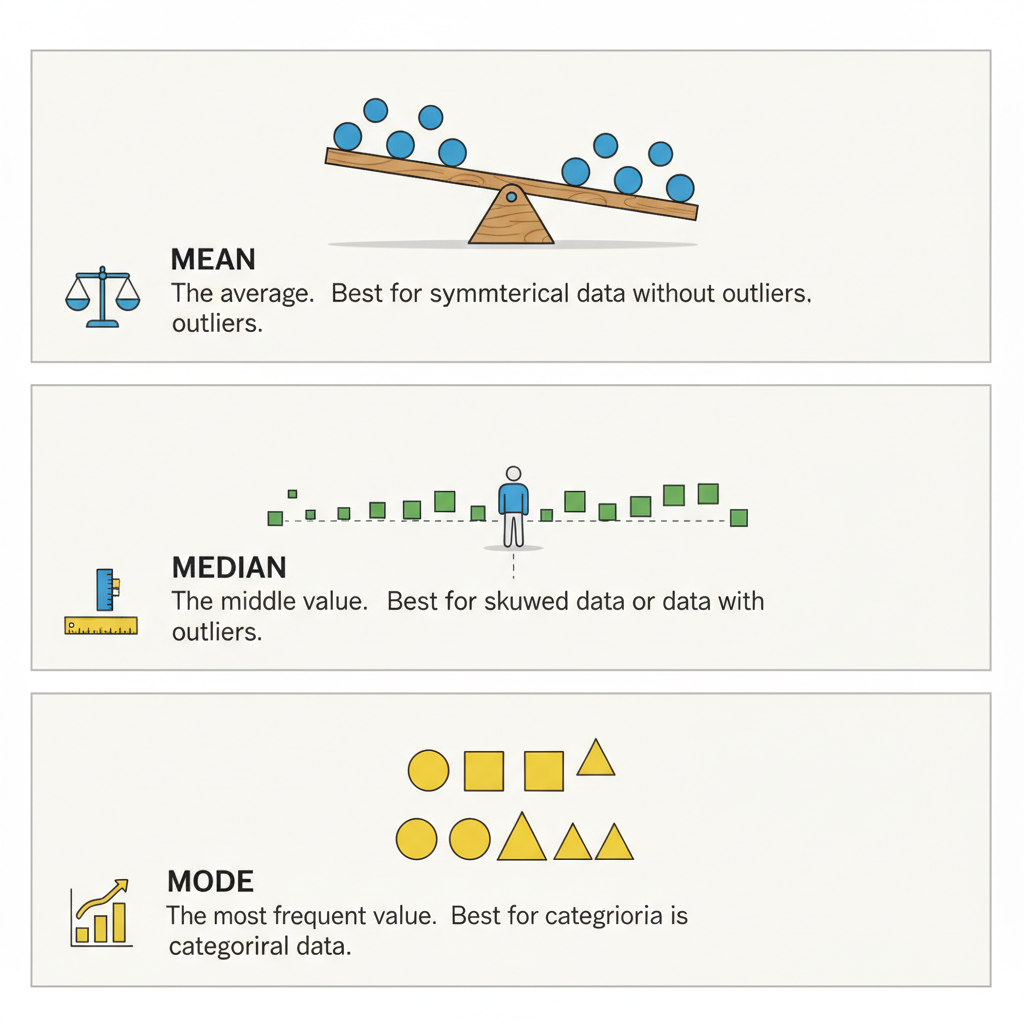
- Analogy: Imagine a seesaw. If you place all your data points on the seesaw, the mean is the exact spot where you'd have to put the pivot to make the seesaw perfectly balanced. Every number contributes to pulling the seesaw one way or the other.
When is the Mean the BEST choice?
- When your data is pretty symmetrical. This means if you drew a picture of your data (like a bar graph or dot plot), it would look roughly the same on both sides, like a bell curve.
- When there are no extreme values or 'outliers'. Outliers are numbers that are much, much bigger or much, much smaller than most of the other numbers.
Why is the Mean NOT good with Outliers?
Let's say you're calculating the average income of 10 families in a small town. Nine families earn around
2. The Median: The "Middle Child"
The Median is the middle value when all your numbers are arranged in order from smallest to largest. It's like finding the person standing exactly in the middle of a line when everyone is ordered by height.
- How to Calculate It:
- Arrange all your numbers in order from smallest to largest.
- Find the number exactly in the middle.
- If there's an odd number of data points, it's the single middle number.
- If there's an even number of data points, there will be two middle numbers. You find the average of those two numbers (add them up and divide by 2) to get your median.
- Analogy: Imagine you have a line of students ordered by their test scores. The student exactly in the middle of that line represents the median score. Half the students scored higher, and half scored lower.
When is the Median the BEST choice?
- When your data is skewed. This means the data is 'bunched up' on one side and has a long 'tail' on the other. For example, many low scores and a few very high scores (skewed right), or many high scores and a few very low scores (skewed left).
- When there ARE outliers! This is where the median shines. Because it only cares about the position of numbers, not their actual values, extreme numbers don't affect it much.
Why is the Median good with Outliers?
Let's go back to our income example. If nine families earn
 ⚠️ This picture may have spelling mistakes. Trust the words in the lesson.
3. The Mode: The "Most Popular" Choice
The Mode is simply the number that appears most often in a data set. Think of it like a popularity contest!
- How to Calculate It: Look at your list of numbers and see which one shows up the most frequently.
- Analogy: If you asked everyone in your class their favorite ice cream flavor, the flavor chosen by the most students would be the mode.
When is the Mode the BEST choice?
- When you're dealing with categorical data. This is data that isn't numbers, like colors, types of cars, or favorite animals. The mean and median don't make sense here (you can't average 'red' and 'blue').
- When you want to know the most frequent or popular item, even with numerical data. For example, what's the most common shoe size sold?
Why might the Mode NOT always be the best choice for numbers?
- Sometimes, there might be no mode (if all numbers appear only once).
- Sometimes, there might be multiple modes (if two or more numbers appear with the same highest frequency).
- For numerical data, it might not always represent the 'center' very well if the most popular number is far away from the bulk of the data.
Putting it All Together: How to Choose!
Here's a simple guide to help you decide which measure of center is your best detective:
- Look for Outliers: Are there any extremely high or extremely low numbers that stand out?
- YES, there are outliers: The Median is usually your best bet. It's resistant to being pulled by those extreme values.
- NO, there are no significant outliers: Move to step 2.
- Consider the Shape of the Data (or type of data):
- Is the data generally symmetrical (looks balanced)? Then the Mean is a great choice. It uses all the data points, giving a good overall average.
- Is the data categorical (like colors, names, types) or are you interested in the most frequent value? Then the Mode is what you need.
Remember, the goal is to pick the measure that best represents the typical or central value of your data set. Just like a carpenter chooses the right tool for the job, a statistician chooses the right measure of center!
Quick Summary Table:
| Measure | What it is | Best Used When... | Weakness |
|---|---|---|---|
| Mean | The average (sum divided by count) | Data is symmetrical, no outliers | Sensitive to outliers |
| Median | The middle value (when ordered) | Data is skewed, or contains outliers | Doesn't use all data values directly |
| Mode | The most frequent value | Data is categorical, or finding popularity | Can have no mode or multiple modes; may not represent numerical center well |
Keep learning, free
Create a free Syllabax account to unlock practice questions and games for this topic.
Visual Learning Enhanced! 🚀
To help you master this topic, we use Advanced Syllabax AI to generate detailed diagrams and visual models.
Note on Visuals: The AI sometimes makes spelling errors in image labels. Please refer to the lesson text for the correct terminology.