Dot Plots: Displaying Small Data
Watch this topic in 60 seconds
Free preview · Lesson 1
Understanding Dot Plots: Displaying Small Data
Dot Plots: Displaying Small Data – A Visual Adventure for 5th Graders!
Hey there, future data detectives! Have you ever tried to organize your toys, your crayons, or even your favorite snacks so you can see them all at once? That’s a bit like what we do with something super cool called a Dot Plot! It’s a fantastic way to show a small amount of information, or 'data,' in a neat and tidy picture.
What is Data, Anyway? (It's Easier Than You Think!)
Imagine your teacher asks everyone in class, 'How many pets do you have?' Some kids might say 0, others 1, some 2, and maybe one friend has 3! All those numbers – 0, 1, 2, 3 – that's called data. Data is just information or facts that we collect. It could be anything: how many books you read last month, the number of sunny days in a week, or even how many times you tied your shoes this morning!
For dot plots, we usually work with 'small data.' This means we don't have hundreds or thousands of numbers. We have just enough so that we can easily see everything without getting overwhelmed. Think of it like a small basket of apples – easy to count and see each one!
Introducing the Dot Plot: Your Data's New Best Friend!
A dot plot is like a special drawing board for your data. It uses dots stacked up above a number line to show how often each number appears. Each dot is like a little sticker representing one piece of information. When you put all the stickers in the right place, you can quickly see patterns and answer questions about your data.
Imagine you're trying to figure out the most popular shoe size in your class. You could list all the sizes, but a dot plot makes it super easy to spot the trend!
The Building Blocks of a Dot Plot:
1. The Number Line: The Foundation
Think of a number line as the street where all your data lives. It's a straight line with numbers marked on it, usually in order from smallest to largest. This line helps us organize our information. If your data is about shoe sizes from 1 to 5, your number line would go from 1 to 5.
2. The Dots: Your Data Stickers!
Each dot on a dot plot represents one single piece of data. If two students have a shoe size of 3, you would put two dots above the number 3 on your number line. It's like giving each student who said '3' their own special sticker on the '3' spot!
Let's Make a Dot Plot Together! (Step-by-Step Guide)
Let's say we asked five friends how many siblings (brothers or sisters) they have, and here are their answers:
Friend 1: 2 siblings
Friend 2: 1 sibling
Friend 3: 2 siblings
Friend 4: 0 siblings
Friend 5: 3 siblings
Here's what our raw data looks like:
Original Data: 2, 1, 2, 0, 3
Step 1: Get Your Data Ready
First, we have our data: 0, 1, 2, 2, 3. It's a good idea to put your numbers in order from smallest to largest if they aren't already. This isn't strictly necessary for making the plot, but it can make it easier to count everything.
Step 2: Draw Your Number Line
Look at your data: 0, 1, 2, 3. The smallest number is 0, and the largest is 3. So, we'll draw a number line that includes 0, 1, 2, and 3. Make sure the numbers are evenly spaced.
Step 3: Start Placing Your Dots!
Now, for each number in your data set, place a dot directly above that number on your number line. If you have the same number more than once, stack the dots one above the other, just like stacking blocks!
- For '0': Place one dot above 0.
- For '1': Place one dot above 1.
- For '2': Place one dot above 2.
- For the *next* '2': Place another dot right on top of the first dot above 2.
- For '3': Place one dot above 3.
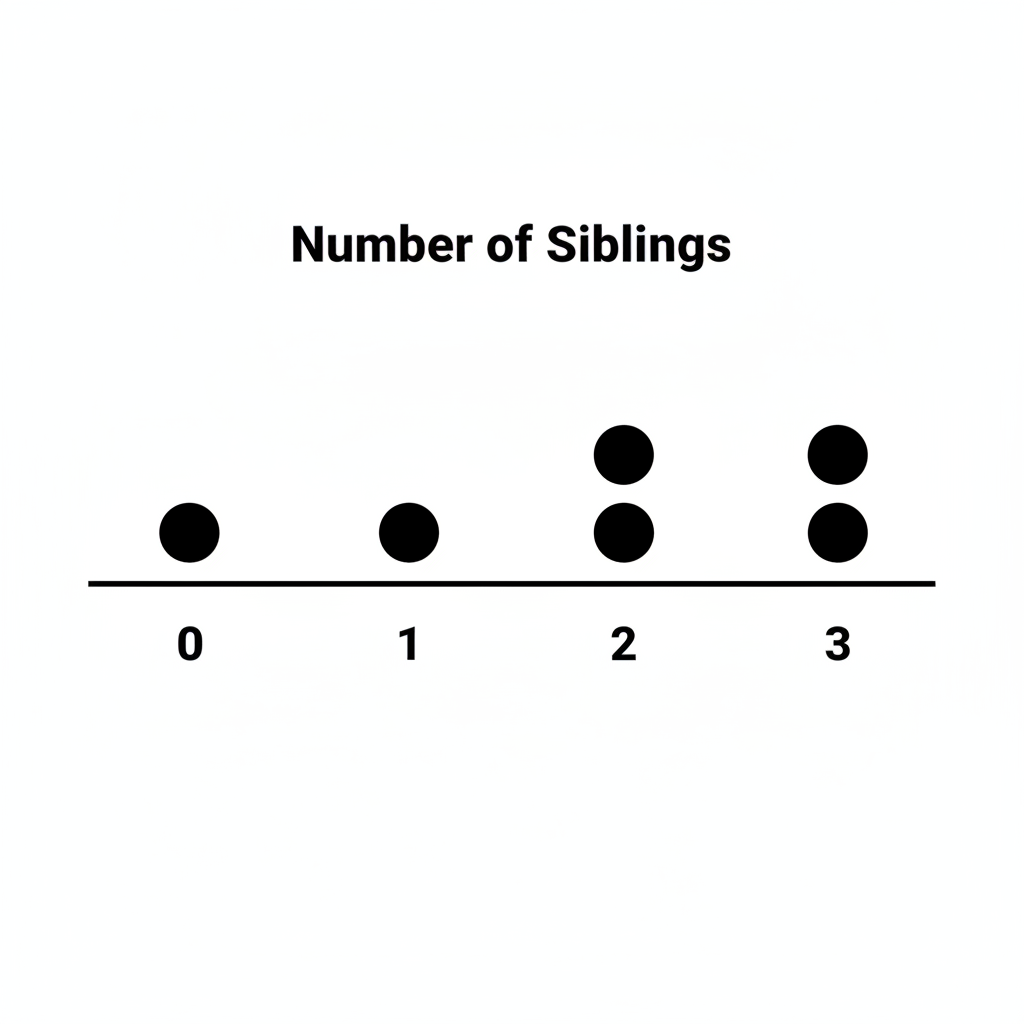
And just like that, you've made a dot plot! Here's what it would look like:
Reading a Dot Plot: What Can It Tell Us?
Once your dot plot is made, it's like a secret code revealing awesome information!
- How many times did a number appear? Just count the dots above that number! In our example, how many friends have 2 siblings? Count the dots above '2' – there are two dots! So, two friends have 2 siblings.
- What's the most common (most popular) answer? Look for the tallest stack of dots! In our example, '2' has the most dots (two dots), so having 2 siblings is the most common answer among our friends. This is also called the 'mode' of the data.
- What's the least common answer? Look for numbers with only one dot, or even no dots! In our example, 0, 1, and 3 all have only one dot, making them equally least common among the collected data points.
- How many pieces of data did we collect in total? Just count *all* the dots! In our example, we have 1 (above 0) + 1 (above 1) + 2 (above 2) + 1 (above 3) = 5 dots. That means we collected data from 5 friends, which matches our original group!
Why are Dot Plots Super Useful?
Dot plots are great because:
- They're easy to understand at a glance. You don't need to read long lists of numbers.
- They quickly show you where most of your data is clustered (grouped) and where it's spread out.
- They are perfect for showing small sets of data clearly.
So, the next time you need to organize and understand a small collection of numbers, think of a dot plot! It's like being a data artist, making information beautiful and easy to read!
Keep learning, free
Create a free Syllabax account to unlock practice questions and games for this topic.
Visual Learning Enhanced! 🚀
To help you master this topic, we use Advanced Syllabax AI to generate detailed diagrams and visual models.
Note on Visuals: The AI sometimes makes spelling errors in image labels. Please refer to the lesson text for the correct terminology.