Pictographs (Data Handling)
Watch this topic in 60 seconds
Free preview · Lesson 1
Understanding Pictographs (Data Handling)
Understanding Pictographs: A Fun Way to See Data!
Welcome, super data detectives! Today, we're going on an exciting adventure to learn about something called a pictograph. Have you ever seen a picture that tells a story or shows you something important? A pictograph is like that, but for numbers! It uses pictures to represent information, making it super easy to understand, even if the numbers are big.
What is a Pictograph?
Imagine you have a collection of your favorite toys. Let's say you have 10 toy cars, 5 stuffed animals, and 7 building blocks. How could you show this to a friend without just telling them the numbers?
A pictograph helps us do just that! It's a chart or graph that uses pictures or symbols to show data. Each picture or symbol stands for a certain number of things. It’s like a secret code where each picture unlocks a piece of information!
Why Do We Use Pictographs?
Think about a busy zoo. The zookeeper wants to know how many animals of each kind they have. They could write down a long list of numbers, but that might be hard to remember or compare. A pictograph makes it easy to see at a glance which animal group is the biggest or smallest.
Analogy: The Favorite Fruit Chart!
Let's say your class is voting for their favorite fruit. Your teacher writes down the votes:
- Apples: 8 votes
- Bananas: 12 votes
- Oranges: 5 votes
Instead of just looking at the numbers, imagine your teacher draws a picture of an apple for each vote, a banana for each vote, and an orange for each vote. This would be a lot of pictures!
That's where the key comes in. The key tells us what each picture represents. For example, the teacher might say: 'One banana drawing = 2 votes'. Now, instead of drawing 12 bananas, they only need to draw 6 banana pictures! This makes the pictograph neat and tidy.
Key Concept: The Key is Your Superpower!
The key is the most important part of a pictograph. It's like a decoder ring that tells you the value of each symbol. Always look at the key first!
How to Read a Pictograph
Let's look at an example. Imagine a pictograph showing how many pets students in a class have:
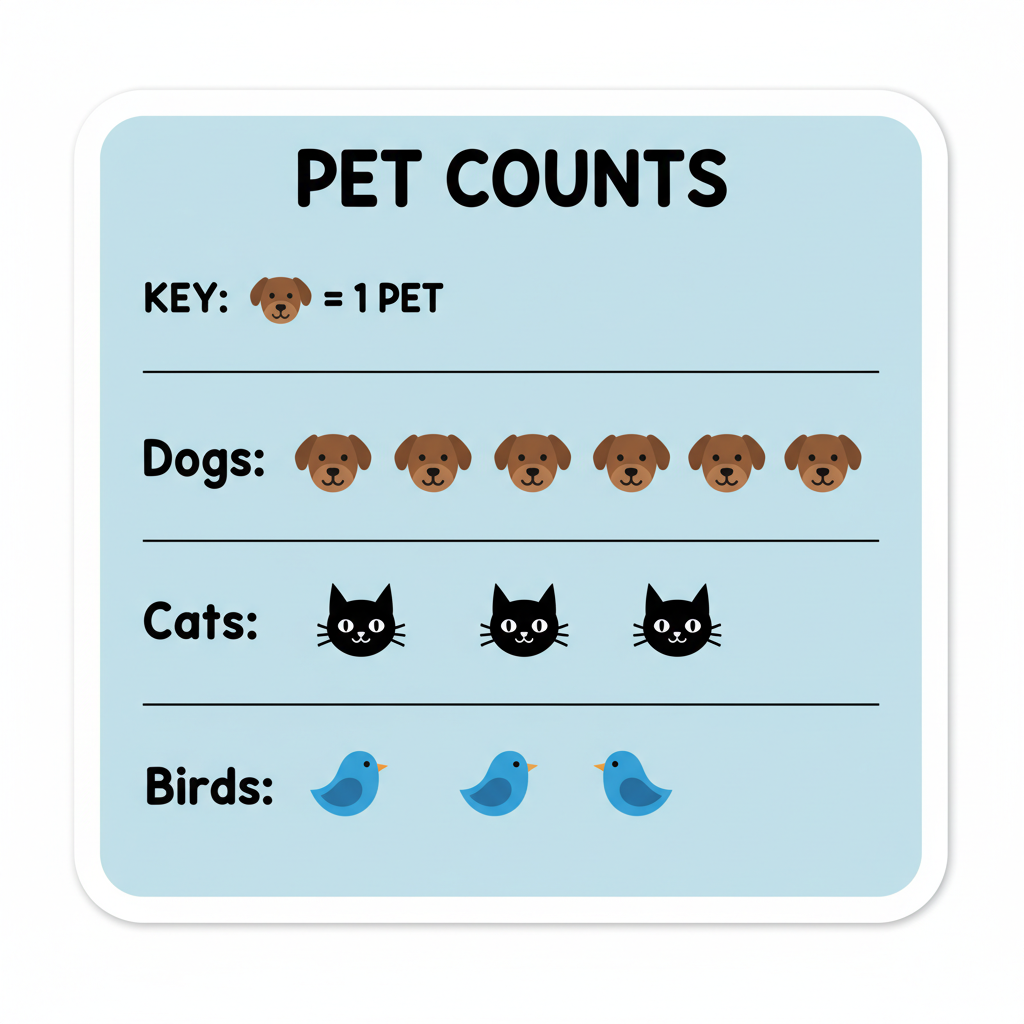
Key: 🐾 = 1 pet
In this pictograph:
- Dogs: There are 4 paw prints (🐾). Since each paw print means 1 pet, there are 4 dogs.
- Cats: There are 3 paw prints (🐾). So, there are 3 cats.
- Fish: There are 5 paw prints (🐾). That means there are 5 fish.
- Birds: There are 2 paw prints (🐾). So, there are 2 birds.
Using this pictograph, we can easily see that fish are the most popular pet in this class, and birds are the least popular.
Making Your Own Pictograph
Let's pretend we want to make a pictograph of the different types of cars parked in a parking lot.
First, we count the cars:
- Red cars: 7
- Blue cars: 5
- White cars: 9
- Black cars: 3
Now, we need to choose a symbol. A simple car symbol would be perfect! But if we drew 7 red car symbols, 5 blue car symbols, and so on, it might take up a lot of space.
This is where we can use the key to make it easier. We can decide that each car symbol represents 2 cars.
- Red cars: 7 cars. That's 3 full car symbols and half a car symbol (3.5 symbols).
- Blue cars: 5 cars. That's 2 full car symbols and half a car symbol (2.5 symbols).
- White cars: 9 cars. That's 4 full car symbols and half a car symbol (4.5 symbols).
- Black cars: 3 cars. That's 1 full car symbol and half a car symbol (1.5 symbols).
Or, we could choose a symbol that represents 1 car. Let's try that for simplicity in our first try!
Let's use a simple smiley face :) to represent 1 type of fruit collected on a nature walk.
Suppose we found:
- Leaves: 6
- Sticks: 8
- Stones: 4
- Feathers: 5
Our key would be: :) = 1 item
Our pictograph would look like:
Key: :) = 1 item
Reading this pictograph:
- Leaves: There are 6 smiley faces, so 6 leaves were found.
- Sticks: There are 8 smiley faces, so 8 sticks were found.
- Stones: There are 4 smiley faces, so 4 stones were found.
- Feathers: There are 5 smiley faces, so 5 feathers were found.
This makes it easy to compare the number of items found! We found the most sticks and the fewest stones.
Things to Remember About Pictographs:
- Pictures represent data: Each picture stands for a certain number of things.
- The key is crucial: Always check the key to know what each picture means.
- Easy to compare: Pictographs help us quickly see which category has the most or least.
- Can use whole or parts of symbols: Sometimes, you might need to draw half a symbol if the number isn't a perfect match for the key.
Pictographs are a fantastic tool for making sense of information. They turn numbers into colorful pictures, making learning fun and easy!
Keep learning, free
Create a free Syllabax account to unlock practice questions and games for this topic.
Visual Learning Enhanced! 🚀
To help you master this topic, we use Advanced Syllabax AI to generate detailed diagrams and visual models.
Note on Visuals: The AI sometimes makes spelling errors in image labels. Please refer to the lesson text for the correct terminology.