Creating Bar Graphs
Watch this topic in 60 seconds
Free preview · Lesson 1
Understanding Creating Bar Graphs
Understanding Bar Graphs: A Visual Storyteller for Your Data!
Hey there, young data detectives! Have you ever tried to compare a bunch of different things, like how many red cars you see versus blue cars, or how many of your friends prefer pizza over tacos? Sometimes, just looking at a list of numbers can be a little confusing, right? That’s where bar graphs come in! Think of a bar graph as a super helpful storyteller that uses pictures (or, well, bars!) to show us information in a way that’s easy to understand and compare.
What is a Bar Graph?
Imagine you have a big collection of your favorite LEGO bricks, and you want to see which color you have the most of. You could count them all and write down: Red: 15, Blue: 10, Green: 20, Yellow: 5. That’s data! But what if you wanted to *see* which one was the tallest stack? A bar graph does just that! It uses rectangular bars to show how much of something there is for different categories.
Core Concept: A bar graph is a chart that uses bars to show comparisons between different categories of data. The length or height of each bar represents the quantity or amount for that category.
Why Are Bar Graphs So Useful?
Bar graphs are like visual shortcuts. Instead of reading a list of numbers, you can glance at a bar graph and instantly see which category has the most, which has the least, or if two categories are nearly the same. It’s like magic for your eyes!
- Easy Comparison: You can quickly compare the sizes of different groups.
- Clear Display: They make numbers and data much easier to understand.
- Quick Insights: You can spot patterns or trends at a glance.
The Essential Parts of a Bar Graph: Building Blocks of Data!
Just like a house needs walls, a roof, and a door, a bar graph has several important parts that work together to tell your data story.
1. The Title: What's the Story About?
Every good story needs a title, right? The title of your bar graph tells everyone exactly what information the graph is showing. For example, 'Favorite Colors of 6th Graders' or 'Number of Pets Owned by Class A'. It should be clear and descriptive.
2. The Axes: The Foundation of Your Graph!
A bar graph has two main lines that act like the foundation: the horizontal line and the vertical line. We call these 'axes' (say: AX-eez).
- X-axis (Horizontal Axis): This is the line that runs flat across the bottom, just like the horizon you see when you look out at a flat field. On this axis, we put our categories. Categories are the different groups you are comparing. For our LEGO example, the categories would be 'Red', 'Blue', 'Green', 'Yellow'. Each category needs a label. We also need to label the entire X-axis, perhaps 'LEGO Colors'.
- Y-axis (Vertical Axis): This is the line that goes straight up and down, like a tall building. On this axis, we put our values or quantities – basically, 'how many' or 'how much'. This is where we show the height of our bars. For our LEGO example, this would be the 'Number of LEGO Bricks'. This axis also needs a label.
3. The Bars: The Visual Storytellers!
These are the colorful, rectangular blocks that give the bar graph its name! Each bar represents one category. The most important thing about the bars is their height (or length, if the bars go sideways):
- Height Tells the Tale: The taller a bar is, the more of that category there is. If a bar for 'Green LEGOs' is much taller than the bar for 'Yellow LEGOs', it means you have many more green bricks than yellow ones!
- Even Width: All the bars should be the same width, and they should have a consistent space between them. This helps make the graph look neat and easy to read.
4. The Scale: Measuring the Height!
How do you know how tall to make a bar? You use the scale on the Y-axis! The scale is a series of numbers placed at equal intervals along the Y-axis. It helps you measure the height of each bar accurately. Think of it like a ruler or a measuring tape. If your scale counts by 1s (0, 1, 2, 3...), it means each line on your Y-axis goes up by one. If it counts by 5s (0, 5, 10, 15...), each line goes up by five. You choose a scale that makes sense for your data – if your numbers are very large, counting by 1s would make your graph too tall!
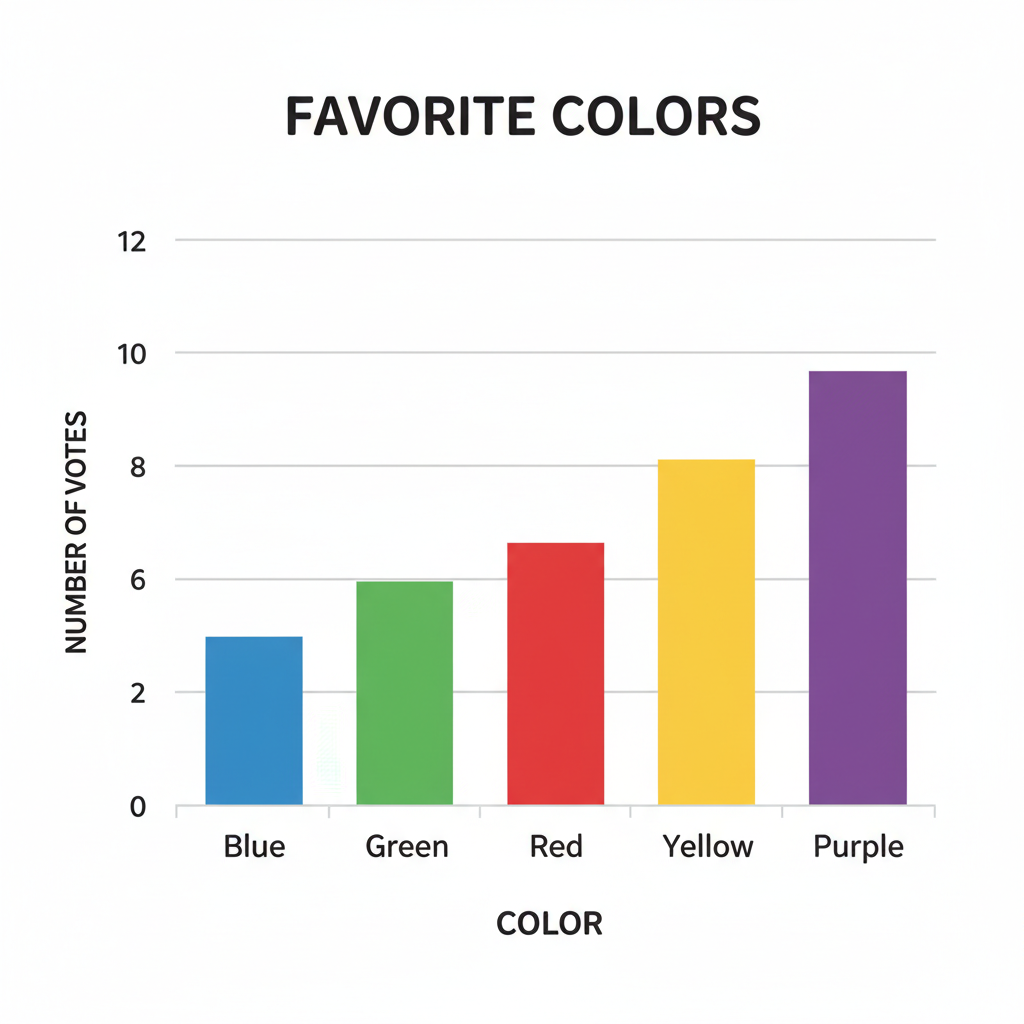
How to Create Your Own Bar Graph: Step-by-Step Guide!
Ready to be a graph-making superstar? Let's walk through the steps!
Step 1: Collect Your Data!
First, you need some information! Decide what you want to compare. For example, let's say you ask your classmates about their favorite fruits and get this data:
- Apples: 8 students
- Bananas: 6 students
- Oranges: 4 students
- Grapes: 10 students
Step 2: Give Your Graph a Great Title!
Based on our data, a good title would be: 'Favorite Fruits of Our Class'.
Step 3: Draw Your Axes!
Draw a horizontal line (X-axis) and a vertical line (Y-axis) that meet at a corner. This corner is usually where you start counting from zero.
Step 4: Label Your X-axis (Categories)!
On your X-axis, write down your categories, evenly spaced. In our example: 'Apples', 'Bananas', 'Oranges', 'Grapes'. Don't forget to label the entire axis: 'Types of Fruit'.
Step 5: Label Your Y-axis (Scale and Label)!
Look at your numbers (8, 6, 4, 10). What's the highest number? It's 10. So, your Y-axis needs to go up to at least 10. Counting by 1s would work perfectly here (0, 1, 2, 3... up to 10 or 12). Mark these numbers clearly along the vertical line. Then, label the entire Y-axis: 'Number of Students'.
Step 6: Draw Your Bars!
Now for the fun part! For each category on the X-axis, draw a bar upwards until its top reaches the correct number on the Y-axis.
- For 'Apples' (8 students), draw a bar that goes up to the '8' mark on the Y-axis.
- For 'Bananas' (6 students), draw a bar that goes up to the '6' mark.
- For 'Oranges' (4 students), draw a bar that goes up to the '4' mark.
- For 'Grapes' (10 students), draw a bar that goes up to the '10' mark.
Make sure your bars are all the same width and have equal spaces between them. You can even color them in to make your graph more appealing!
And just like that, you’ve created a bar graph! Now, with a quick glance, anyone can see that grapes are the most popular fruit in your class, and oranges are the least. You’re now a data visualization expert!
Keep learning, free
Create a free Syllabax account to unlock practice questions and games for this topic.
Visual Learning Enhanced! 🚀
To help you master this topic, we use Advanced Syllabax AI to generate detailed diagrams and visual models.
Note on Visuals: The AI sometimes makes spelling errors in image labels. Please refer to the lesson text for the correct terminology.