Learning Journey
Free preview · Lesson 1
Understanding Recording Experiment Outcomes
Recording Experiment Outcomes: Becoming a Science Detective!
Welcome, young scientists! Today, we're going to learn a super important skill for any scientist: how to keep track of what happens during an experiment. Think of it like being a detective, but instead of solving a mystery with clues, you're discovering how the world works by writing down what you see!
What is an Experiment?
First, let's remember what an experiment is. An experiment is like trying something new to see what will happen. Have you ever tried baking a cake with a new recipe? You follow the steps, put it in the oven, and then you see (and taste!) what happens. That's an experiment! In science, we do experiments to test an idea or answer a question, like "Does a plant grow faster with more sunlight?" or "Which paper airplane design flies the furthest?"
What are "Outcomes"?
After you do your experiment (like baking your cake or flying your paper airplane), something happens, right? The cake might be delicious, or it might be a little burnt. The paper airplane might fly across the room, or it might just drop to the floor. These things that happen – the results, the changes, what you observe – are called the outcomes of your experiment. They are the answers to your question!
Why is Recording Outcomes Important? (Like Writing in a Diary)
Imagine you baked that cake, and it was the most delicious cake ever! But you forgot to write down the recipe or what you did. How would you make it again? You wouldn't know! That's why recording outcomes is so, so important in science. Here's why:
- To Remember: Your brain is amazing, but it can forget details! Writing things down helps you remember exactly what happened, even days or weeks later.
- To Share: If you discover something really cool, you'll want to tell your friends, family, or even other scientists! Your recorded outcomes help you explain clearly what you found.
- To Repeat: Sometimes, scientists need to do an experiment more than once to make sure their results are correct. If you recorded everything, it's easy to do the exact same experiment again.
- To Learn: Even if an experiment doesn't go as planned, recording the outcomes helps you learn from your mistakes and figure out what to try next time.
- To Prove an Idea: If you have an idea (a hypothesis) about how something works, your recorded outcomes provide the evidence to show if your idea was right or wrong.
Tools for Recording: How to Keep Track
Now, let's look at the different ways you can record what happens during your experiments. Think of these as your detective tools!
1. Your Senses: Observing Carefully
The very first way to record is by using your amazing five senses: sight, hearing, touch, smell, and even taste (though be careful with taste in science experiments!). This is called observation. You watch, listen, feel, and smell what's happening. For example, if you're watching a seed sprout, you might observe that you *see* a tiny green shoot, or *feel* the soil getting drier.
You can write down what you observe in a notebook, just like a diary entry. For instance, "Day 3: The seed has a small white root emerging."
2. Numbers: Measuring Things
Many times, just seeing or describing isn't enough. We need exact numbers! This is called measurement. When you measure, you use special tools to find out how much, how long, how heavy, or how hot something is. It's like keeping score in a game – you need numbers to know who won!
- Length: How long or tall something is. You use a ruler or measuring tape. (e.g., "The plant grew 2 centimeters taller.")
- Weight: How heavy something is. You use a scale. (e.g., "The rock weighed 50 grams.")
- Time: How long something takes. You use a stopwatch or clock. (e.g., "The ice melted in 15 minutes.")
- Temperature: How hot or cold something is. You use a thermometer. (e.g., "The water was 25 degrees Celsius.")
- Volume: How much space a liquid takes up. You use a measuring cup or beaker. (e.g., "I added 10 milliliters of water.")
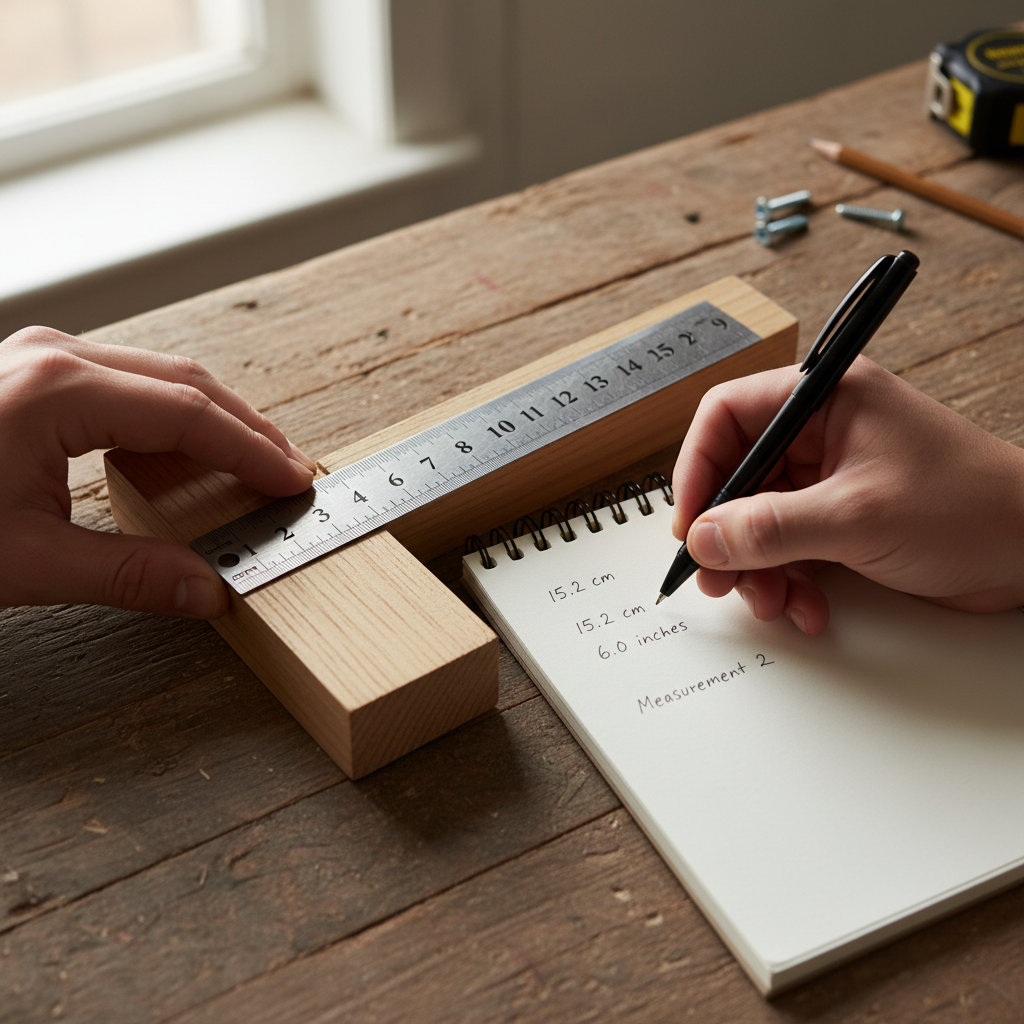
Recording numbers is great because it's very precise and easy to compare later.
3. Words: Describing What You See
Sometimes, numbers alone aren't enough to tell the whole story. You'll need to use descriptive words. Think of it like writing a story about your experiment! For example, instead of just saying "the liquid changed," you could write, "The clear liquid slowly turned a cloudy, milky white, and small bubbles began to appear at the bottom of the beaker." Being very specific with your words helps paint a clearer picture of what happened.
4. Pictures: Drawing and Diagrams
"A picture is worth a thousand words," right? Sometimes, the best way to record an outcome is to draw it! If you're observing a bug, drawing a detailed picture shows its shape, colors, and number of legs much better than just writing a description. Diagrams can show how something is put together or how it changed over time.
5. Tables and Charts: Organizing Your Information
When you have a lot of observations or measurements, especially over time or for many different things, it's best to put them into a table or chart. A table has rows and columns, like a checkerboard. Each column can be for a different type of information (like "Day," "Plant A Height," "Plant B Height"), and each row can be for a different observation. This keeps your information super organized and easy to read. Imagine trying to keep track of all your favorite TV shows without a schedule – it would be a mess! A table is like a schedule for your data.
6. Graphs: Showing Patterns and Changes
Once you have your data in a table, you might want to see if there are any patterns or how things changed over time. That's when graphs come in handy! A bar graph can show you how different things compare (like which paper airplane flew the furthest). A line graph is great for showing how something changes over time (like how a plant grows taller each week). Graphs make it easy to see the "story" of your experiment at a glance.
 ⚠️ This picture may have spelling mistakes. Trust the words in the lesson.
Golden Rules for Recording
To be the best science detective, always follow these rules when you record your outcomes:
- Be Accurate: Always write down exactly what you see, hear, measure, or feel. Don't make things up or change them to fit what you *think* should have happened. Be truthful!
- Be Detailed: Include all the important small bits of information. "The plant grew" isn't as helpful as "The plant grew 3 cm and developed two new leaves."
- Be Consistent: If you decide to measure plant height in centimeters, always use centimeters. If you record observations every Monday, do it every Monday. Doing things the same way each time makes your results fair.
- Record Immediately: Write down your observations as soon as they happen. If you wait, you might forget important details!
- Record What You SEE: This is a big one! Don't write down what you *wish* happened, or what you *expected* to happen. Only write down what your senses and measuring tools actually tell you.
Let's Practice: Our Plant Experiment!
Imagine you're doing an experiment to see if plants grow taller with more water. You have two identical plants:
- Plant A: Gets a lot of water every day.
- Plant B: Gets very little water every day.
You would want to set up a table like this in your notebook:
| Day | Plant A Height (cm) | Plant A Observations | Plant B Height (cm) | Plant B Observations |
|---|---|---|---|---|
| 1 | 5.0 | Green, healthy leaves. | 5.0 | Green, healthy leaves. |
| 3 | 6.5 | Taller, leaves still green. | 5.1 | Slightly yellowing leaves. |
| 5 | 8.0 | Strong, dark green. | 5.0 | Leaves droopy, turning brown. |
See how neat and clear that is? You can quickly look at the table and understand what happened to each plant over time!
You're a Science Super-Recorder!
Recording experiment outcomes might seem like a lot of work, but it's one of the most exciting and important parts of being a scientist. It's how you organize your discoveries, share them with the world, and build new knowledge. Keep practicing these skills, and you'll be an amazing science detective in no time!
Keep learning, free
Create a free Syllabax account to unlock practice questions and games for this topic.
Visual Learning Enhanced! 🚀
To help you master this topic, we use Advanced Syllabax AI to generate detailed diagrams and visual models.
Note on Visuals: The AI sometimes makes spelling errors in image labels. Please refer to the lesson text for the correct terminology.