What Does the Graph Tell Us?
Watch this topic in 60 seconds
Free preview · Lesson 1
Understanding What Does the Graph Tell Us?
What Does the Graph Tell Us?
Hello, young mathematicians! Have you ever seen a picture that tells you a story without using many words? That's kind of like what a graph does! A graph is a special kind of picture that helps us understand numbers and information in a super easy way. Imagine you want to know which ice cream flavor your friends like best. Instead of just listing names and flavors, a graph can show you a clear picture of everyone's favorite!
Why Do We Use Graphs?
Think of a graph like a treasure map for information. If someone told you there were 10 gold coins, 5 silver coins, and 3 bronze coins, that's a lot of numbers to remember! But what if you saw a picture with 10 gold coins, 5 silver coins, and 3 bronze coins drawn out? You'd see right away which treasure there was most of. Graphs do the same thing for numbers. They help us:
- See things clearly: It's easier to spot who has more or less.
- Compare things quickly: You can tell at a glance which item is the most popular or the least popular.
- Understand big numbers: Even if there are lots of numbers, a graph makes them easy to understand.
Meet the Pictograph: Stories with Pictures!
One of the first types of graphs we'll learn about is called a pictograph. "Picto" sounds like picture, right? That's because a pictograph uses pictures or symbols to show information. It's like drawing a little picture for each thing you are counting.
How Does a Pictograph Work?
Imagine you are counting how many apples, bananas, and oranges your friends brought for snack time. Instead of writing '5 apples, 3 bananas, 7 oranges', a pictograph might draw 5 little apple pictures, 3 little banana pictures, and 7 little orange pictures. Pretty neat, huh?
Every pictograph has a very important part called a key. The key tells you what each picture stands for. Sometimes, one picture means just one thing. But sometimes, one picture can mean more than one thing! For example, a key might say, "🍎 = 2 apples." This means if you see one apple picture, it actually counts for two real apples! It's like a secret code you need to unlock.
Let's look at an example of a pictograph:
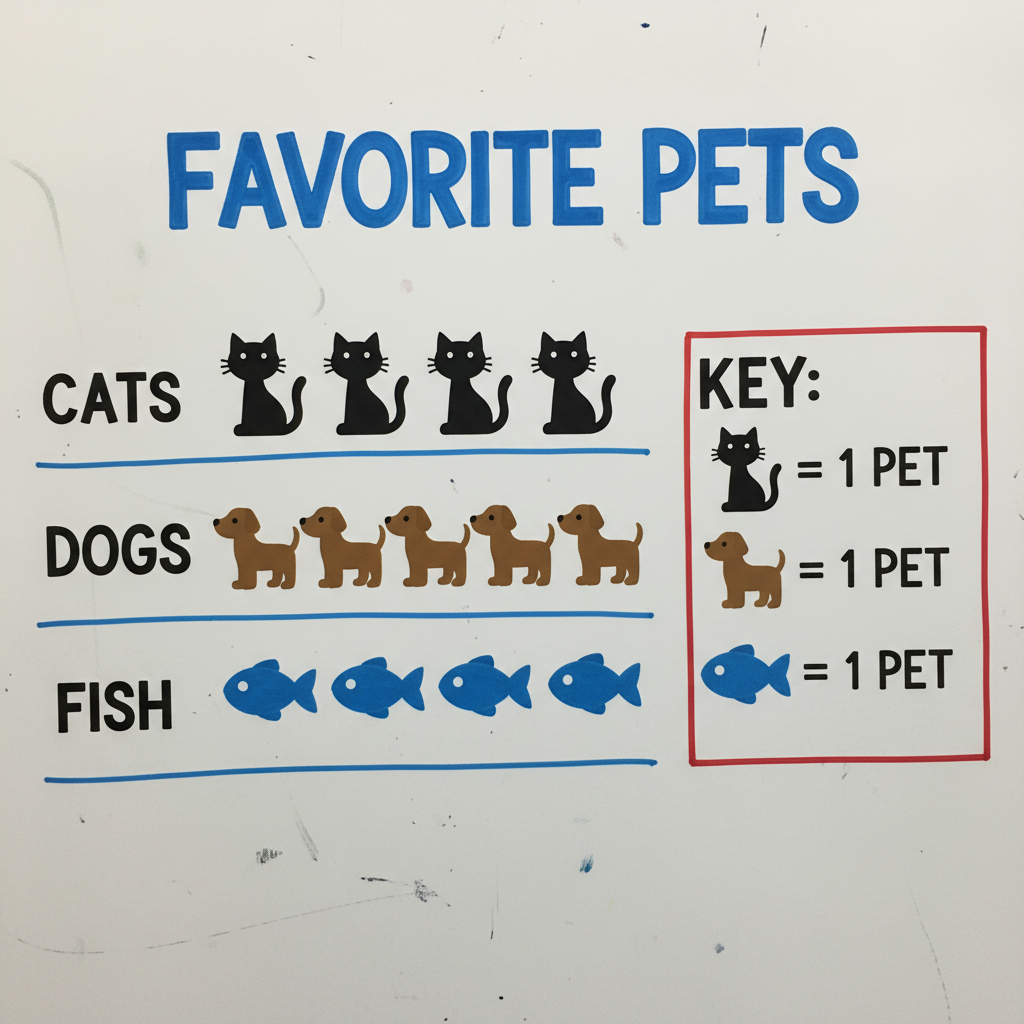
In this pictograph, you can see pictures of different pets. If the key says "Each 🐶 = 1 dog," then you can quickly count how many friends like dogs just by counting the dog pictures!
Meet the Bar Graph: Towers of Information!
Another super common type of graph is called a bar graph. Think of a bar graph like building towers with blocks! Each tower (or "bar") shows you how much of something there is. The taller the tower, the more there is!
How Does a Bar Graph Work?
Bar graphs use thick lines, called bars, to show how many items are in each group. These bars can go up and down (vertical) or sometimes side to side (horizontal).
- Labels: Bar graphs have labels on the bottom and side. The bottom label usually tells you what items you are counting (like 'Red Cars', 'Blue Cars', 'Green Cars'). The side label usually has numbers and tells you 'How Many' (like 0, 1, 2, 3, 4, 5...).
- Scale: The numbers on the side are like a ruler, helping you measure how tall each bar is. If a bar reaches the number '7', it means there are 7 of that item.
- Title: Just like a book has a title, every graph has a title that tells you what the whole graph is about. It helps you know what story the graph is trying to tell.
Let's look at a bar graph:
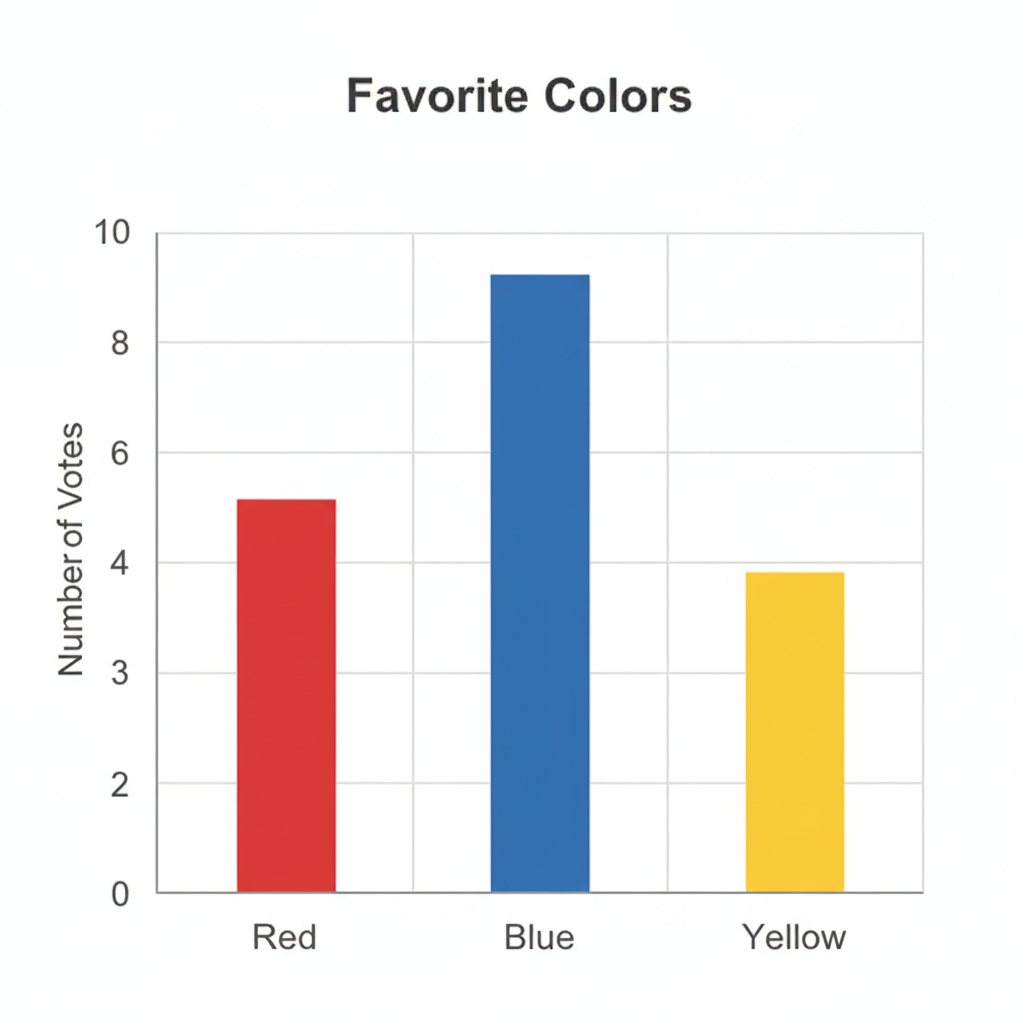
In this bar graph, you can see different colored bars. Maybe the bottom label says 'Colors' and has 'Red', 'Blue', 'Yellow'. The side label says 'Number of Kids'. You can quickly see which color tower is the tallest (most popular) and which is the shortest (least popular)!
Reading the Story a Graph Tells
Reading a graph is like reading a secret message. Here's how to become a graph detective:
- Look at the Title First: What is the graph about? Is it about favorite animals, how many candies you have, or something else?
- Check the Labels: What are the things being counted (like 'Dogs' or 'Apples')? What do the numbers mean (like 'How Many Kids' or 'Number of Toys')?
- Find the Key (for Pictographs): If it's a pictograph, what does each picture stand for? Is one picture equal to 1, or 2, or even 5?
- Look at the Bars or Pictures: Now you can start comparing!
- Which bar is the tallest? That's the most!
- Which bar is the shortest? That's the least!
- How many of each item are there? Follow the bar or count the pictures.
Graphs are powerful tools that help us make sense of the world around us. From knowing which fruit is most popular in your class to understanding how many sunny days there were in a month, graphs help us see the whole picture at a glance. Keep practicing, and you'll be a graph expert in no time!
Keep learning, free
Create a free Syllabax account to unlock practice questions and games for this topic.
Visual Learning Enhanced! 🚀
To help you master this topic, we use Advanced Syllabax AI to generate detailed diagrams and visual models.
Note on Visuals: The AI sometimes makes spelling errors in image labels. Please refer to the lesson text for the correct terminology.