Graphical representation (Linear Equations in Two Variables)
Watch this topic in 60 seconds
Free preview · Lesson 1
Understanding Graphical representation (Linear Equations in Two Variables)
Understanding Linear Equations in Two Variables: A Graphical Journey
Welcome, future mathematicians! Today, we're embarking on an exciting journey to explore the world of Linear Equations in Two Variables. Don't let the big words scare you! Think of it like learning to read a treasure map, where the 'treasure' is a specific relationship between two things, and the 'map' helps us visualize it.
At Grade 9, understanding this topic is like learning the basic building blocks of many real-world problems. Whether it's tracking how much money you save each week or how far you can travel in a certain amount of time, linear equations are everywhere!
What Exactly Are We Talking About?
The 'Variables' - Our Mystery Guests
Imagine you have a recipe, but some ingredients are written as 'X cups of flour' and 'Y eggs'. 'X' and 'Y' are your variables. They are symbols (usually letters like x, y, a, b) that stand for numbers we don't know yet, or numbers that can change. In our topic, we'll almost always use 'x' and 'y' because they are super popular in graphing.
The 'Linear' Part - Straight and Narrow
Think of the word "line." That's exactly what 'linear' means here! When you graph a linear equation, the picture you get on your 'map' is always a perfectly straight line. No curves, no wiggles, just straight paths. It's like walking on a perfectly straight road – easy to follow!
The 'Equation' - A Perfect Balance
An equation is like a balanced seesaw or a scale. What's on one side must be equal to what's on the other side. For example, in x + y = 5, the value of 'x' added to the value of 'y' must always equal 5. It's a rule that 'x' and 'y' have to follow together.
'In Two Variables' - Keeping Track of Two Things
This simply means our equations will have two different mystery guests, usually 'x' and 'y'. For example, 2x + 3y = 10. We need to find pairs of 'x' and 'y' that make this statement true.
So, a Linear Equation in Two Variables is just an equation with two unknown numbers (variables), which, when graphed, always forms a straight line!
Our Treasure Map: The Coordinate Plane
To draw our straight lines, we need a special kind of grid, our 'treasure map,' called the Coordinate Plane (or sometimes the Cartesian Plane, named after a famous mathematician, René Descartes). Imagine a flat piece of paper with two number lines crossing each other in the middle, like a giant plus sign.
- The X-axis: This is the horizontal (side-to-side) number line. Think of it as the street you walk along, left or right from a starting point. Moving right means positive numbers, moving left means negative numbers.
- The Y-axis: This is the vertical (up-and-down) number line. Think of it as the building floors you go up or down. Moving up means positive numbers, moving down means negative numbers.
- The Origin: This is the exact spot where the X-axis and Y-axis cross. It's like the "start" button on your map, always represented by the coordinates (0, 0).
- Coordinates (x, y): Every single spot on this map has a unique "address" called its coordinates. This address is always written as a pair of numbers inside parentheses, like (3, 2). The first number tells you how far to go along the X-axis (left/right), and the second number tells you how far to go along the Y-axis (up/down). Think of (3, 2) as "go 3 steps right, then 2 steps up."
Let's visualize this map!
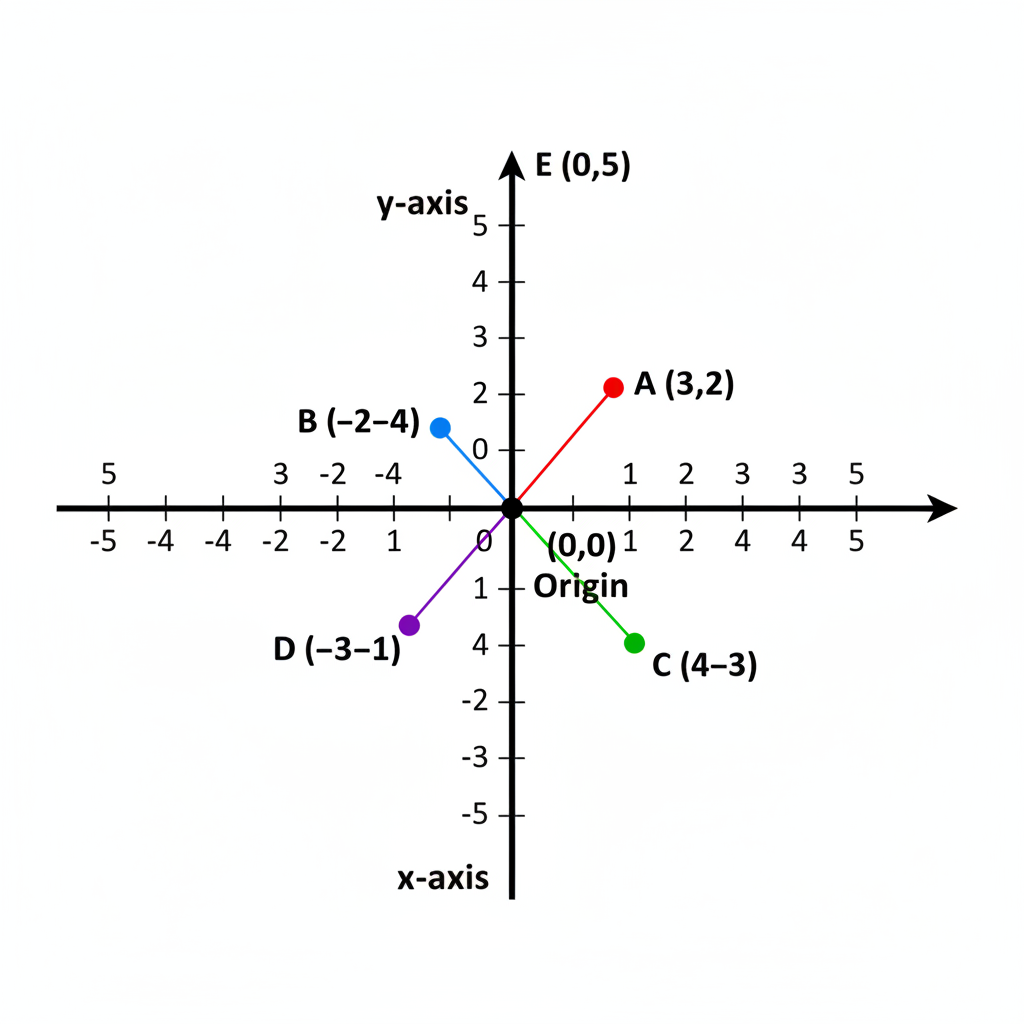 ⚠️ This picture may have spelling mistakes. Trust the words in the lesson.
Plotting Points: Finding Your Way Around
To plot a point like (4, -2):
- Start at the Origin (0,0).
- Look at the first number (x-coordinate), which is 4. Move 4 units to the RIGHT along the X-axis.
- Look at the second number (y-coordinate), which is -2. From where you are on the X-axis, move 2 units DOWN (because it's negative) parallel to the Y-axis.
- That's your point!
Practice plotting a few points in your head: (2, 5), (-3, 1), (0, -4), (-1, -2).
What is a 'Solution' to a Linear Equation?
Remember our seesaw analogy? For an equation like x + y = 7, a solution is any pair of (x, y) numbers that makes the equation true. For example:
- If x = 1, then y must be 6 (because 1 + 6 = 7). So, (1, 6) is a solution.
- If x = 0, then y must be 7 (because 0 + 7 = 7). So, (0, 7) is a solution.
- If x = 10, then y must be -3 (because 10 + (-3) = 7). So, (10, -3) is a solution.
Each of these (x, y) pairs is a point on our coordinate plane. When you graph all the possible solutions, they will all magically line up to form a straight line!
How to Graph a Linear Equation: Two Easy Methods
Since we know a linear equation always makes a straight line, we only need to find at least two solution points to draw the line. Think of it like connecting two dots to draw a straight line segment – it always works! A third point is often a good idea to check your work.
Method 1: The "Find-a-Few-Friends" Method (Plotting Points)
This is the most straightforward method. We're going to pick some 'x' values, find their 'y' partners, and plot these 'friends'.
Let's graph the equation: y = 2x + 1
- Make a Table: Create a small table with columns for x, y, and the (x, y) pair.
- Pick Simple 'x' Values: Choose values for 'x' that are easy to work with, like 0, 1, -1, 2.
- Calculate 'y': Substitute each 'x' value into the equation and solve for 'y'.
- If x = 0: y = 2(0) + 1 = 0 + 1 = 1. So, point is (0, 1).
- If x = 1: y = 2(1) + 1 = 2 + 1 = 3. So, point is (1, 3).
- If x = -1: y = 2(-1) + 1 = -2 + 1 = -1. So, point is (-1, -1).
- If x = 2: y = 2(2) + 1 = 4 + 1 = 5. So, point is (2, 5).
- Plot the Points: Carefully plot (0, 1), (1, 3), (-1, -1), and (2, 5) on your coordinate plane.
- Draw the Line: Use a ruler to draw a straight line that passes through ALL these points. Extend the line with arrows on both ends to show it continues infinitely.
Voila! You've just graphed your first linear equation!
Method 2: The "Meeting-the-Axes" Method (Using Intercepts)
This method is super efficient because it uses two special points where the line crosses the X-axis and Y-axis. These are called intercepts.
Let's graph the equation: 3x + 2y = 6
- Find the Y-intercept (where the line crosses the Y-axis):
- When a line crosses the Y-axis, its X-coordinate is always 0. (Think: you haven't moved left or right from the origin).
- So, set x = 0 in your equation:
3(0) + 2y = 6 - This simplifies to:
0 + 2y = 6, which means2y = 6. - Divide by 2:
y = 3. - Your Y-intercept point is (0, 3). Plot this point!
- Find the X-intercept (where the line crosses the X-axis):
- When a line crosses the X-axis, its Y-coordinate is always 0. (Think: you haven't moved up or down from the origin).
- So, set y = 0 in your equation:
3x + 2(0) = 6 - This simplifies to:
3x + 0 = 6, which means3x = 6. - Divide by 3:
x = 2. - Your X-intercept point is (2, 0). Plot this point!
- Draw the Line: Now you have two points: (0, 3) and (2, 0). Simply draw a straight line through these two points, extending it with arrows on both ends.
This method is often quicker, especially when the equation is given in the standard form (Ax + By = C).
Special Straight Lines: Horizontal and Vertical
Sometimes you'll encounter equations that look a little different, like x = 3 or y = -2. Don't worry, they're still linear equations!
- Equations like
x = a(e.g.,x = 3): This means that no matter what 'y' is, 'x' must always be 3. If you plot points like (3, 0), (3, 1), (3, -2), they will all line up to form a vertical line passing through x=3 on the X-axis. Think of it as a fence post at 'x=3' on the road. - Equations like
y = b(e.g.,y = -2): This means that no matter what 'x' is, 'y' must always be -2. If you plot points like (0, -2), (1, -2), (-4, -2), they will all line up to form a horizontal line passing through y=-2 on the Y-axis. Think of it as a flat bridge at 'y=-2' over the road.
Why is This Important?
Understanding how to graph linear equations isn't just a math exercise; it's a powerful tool! It helps us:
- Visualize relationships: See how one variable changes in response to another.
- Solve problems: Find the 'breaking point' or 'meeting point' of different scenarios.
- Make predictions: Extend the line to estimate future values.
Keep practicing, and soon you'll be a master cartographer of the coordinate plane!
Keep learning, free
Create a free Syllabax account to unlock practice questions and games for this topic.
Visual Learning Enhanced! 🚀
To help you master this topic, we use Advanced Syllabax AI to generate detailed diagrams and visual models.
Note on Visuals: The AI sometimes makes spelling errors in image labels. Please refer to the lesson text for the correct terminology.